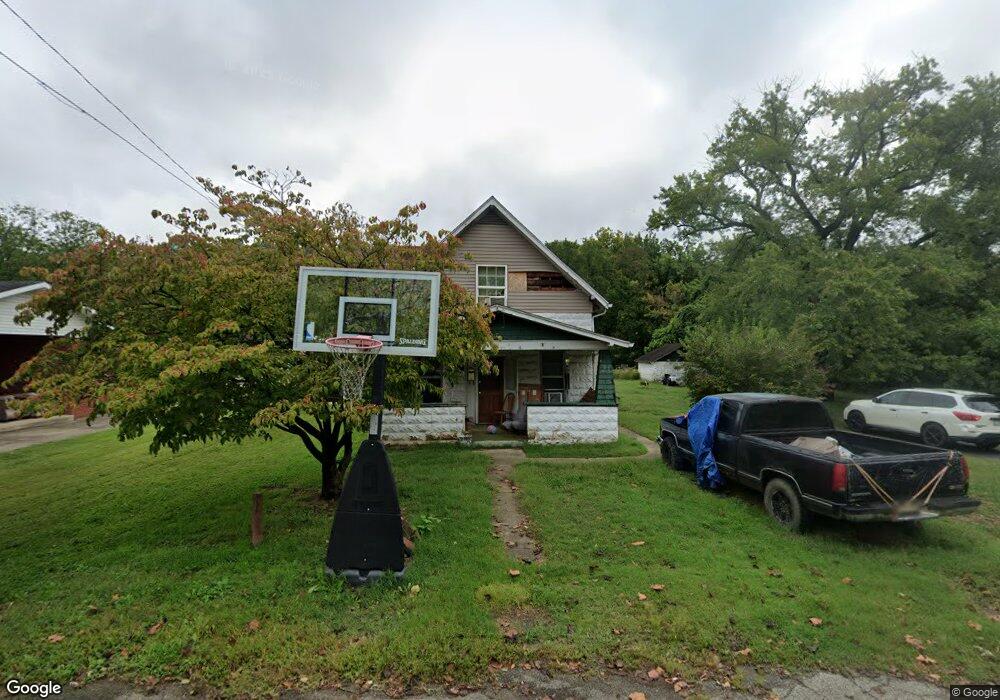
811 High St Coal Grove, OH 45638
Estimated Value: $103,000 - $114,410
3
Beds
1
Bath
1,252
Sq Ft
$86/Sq Ft
Est. Value
About This Home
This home is located at 811 High St, Coal Grove, OH 45638 and is currently estimated at $107,603, approximately $85 per square foot. 811 High St is a home located in Lawrence County with nearby schools including Dawson-Bryant Elementary School, Dawson-Bryant Middle School, and Dawson-Bryant High School.
Ownership History
Date
Name
Owned For
Owner Type
Purchase Details
Closed on
Oct 11, 2018
Sold by
Carey Judy Sue
Bought by
Carey Judy Sue Life Estate
Current Estimated Value
Purchase Details
Closed on
Aug 29, 2018
Sold by
Bryant William R Life Est Rem Judy Sue Carey
Bought by
Carey Judy Sue
Purchase Details
Closed on
May 19, 2008
Sold by
Chapman Paul Lee and Chapman Paul Randall
Bought by
Bryant William R and Carey Judy Sue
Home Financials for this Owner
Home Financials are based on the most recent Mortgage that was taken out on this home.
Original Mortgage
$30,400
Interest Rate
6.09%
Mortgage Type
Purchase Money Mortgage
Purchase Details
Closed on
Dec 30, 2004
Sold by
Chapman Paul Lee and Chapman Ann L
Bought by
Chapman Paul Lee and Chapman Ann L
Create a Home Valuation Report for This Property
The Home Valuation Report is an in-depth analysis detailing your home's value as well as a comparison with similar homes in the area
Home Values in the Area
Average Home Value in this Area
Purchase History
| Date | Buyer | Sale Price | Title Company |
|---|---|---|---|
| Carey Judy Sue Life Estate | -- | -- | |
| Carey Judy Sue | -- | -- | |
| Bryant William R | $38,000 | Attorney | |
| Chapman Paul Lee | -- | -- |
Source: Public Records
Mortgage History
| Date | Status | Borrower | Loan Amount |
|---|---|---|---|
| Previous Owner | Bryant William R | $30,400 |
Source: Public Records
Tax History
| Year | Tax Paid | Tax Assessment Tax Assessment Total Assessment is a certain percentage of the fair market value that is determined by local assessors to be the total taxable value of land and additions on the property. | Land | Improvement |
|---|---|---|---|---|
| 2025 | $827 | $29,026 | $12,198 | $16,828 |
| 2024 | -- | $27,920 | $11,090 | $16,830 |
| 2023 | -- | $27,920 | $11,090 | $16,830 |
| 2022 | $825 | $27,920 | $11,090 | $16,830 |
| 2021 | $738 | $24,240 | $10,300 | $13,940 |
| 2020 | $754 | $24,240 | $10,300 | $13,940 |
| 2019 | $751 | $24,240 | $10,300 | $13,940 |
| 2018 | $760 | $24,240 | $10,300 | $13,940 |
| 2017 | $759 | $24,240 | $10,300 | $13,940 |
| 2016 | $704 | $24,240 | $10,300 | $13,940 |
| 2015 | $705 | $22,520 | $10,300 | $12,220 |
| 2014 | $652 | $22,520 | $10,300 | $12,220 |
| 2013 | $651 | $22,520 | $10,300 | $12,220 |
Source: Public Records
Map
Nearby Homes
- 805 1/2 High St
- 222 Saint Charles St
- 514 Lane St
- 519 Lane St
- 303 Pike St
- 105 Compliment St
- 103 Carrico Dr
- 1003 Marion Pike
- 0 Central & Mlk
- 1510 Winchester Ave
- 1400 Montgomery Ave
- 1824 Carter Ave
- 1417 Lexington Ave
- 0 18th Street & Central Ave
- 1100 Price St
- 1336 High St W
- 1605 Lexington Ave
- 0 Carter Ave
- 2805 S 8th St
- 920 Prospect Ave
- 807 High St
- 115 Bowman St
- 112 Fernwood Dr
- 113 Bowman St
- 805 High St
- 111 Bowman St
- 230 Saint Charles St
- 107 Bowman St
- 110 Fernwood Dr
- 110 Fernwood Dr
- 801 High St
- 304 Memorial St
- 105 Bowman St
- 910 High St
- 228 Saint Charles St
- 229 Saint Charles St
- 109 Fernwood Dr
- 103 Bowman St
- 107 Fernwood Dr
- 105 Fernwood Dr
Your Personal Tour Guide
Ask me questions while you tour the home.