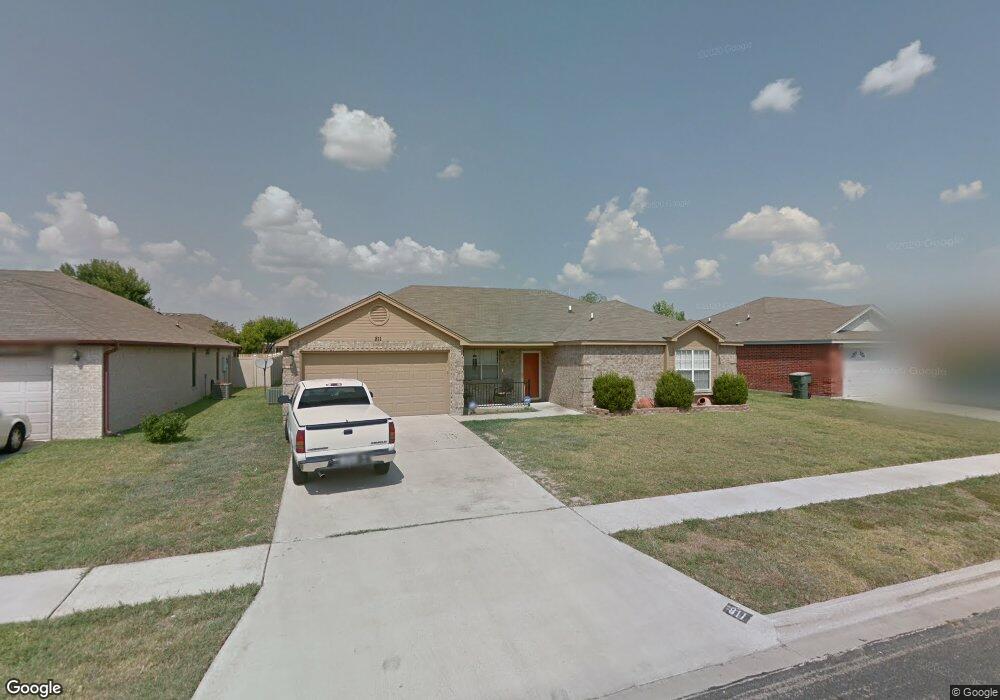
811 James Loop Killeen, TX 76542
Estimated Value: $210,000 - $243,000
4
Beds
2
Baths
1,597
Sq Ft
$142/Sq Ft
Est. Value
About This Home
This home is located at 811 James Loop, Killeen, TX 76542 and is currently estimated at $226,200, approximately $141 per square foot. 811 James Loop is a home located in Bell County with nearby schools including Reeces Creek Elementary School, Charles E. Patterson Middle School, and C. E. Ellison High School.
Ownership History
Date
Name
Owned For
Owner Type
Purchase Details
Closed on
Oct 12, 2022
Sold by
Shellman Shawn
Bought by
Red Rental Group Llc
Current Estimated Value
Purchase Details
Closed on
Aug 23, 2007
Sold by
Rivera Oetro Benjamin and Rivera Carline
Bought by
Shellman Shawn D and Shellman Zina W
Home Financials for this Owner
Home Financials are based on the most recent Mortgage that was taken out on this home.
Original Mortgage
$116,451
Outstanding Balance
$73,957
Interest Rate
6.72%
Mortgage Type
VA
Estimated Equity
$152,243
Create a Home Valuation Report for This Property
The Home Valuation Report is an in-depth analysis detailing your home's value as well as a comparison with similar homes in the area
Home Values in the Area
Average Home Value in this Area
Purchase History
| Date | Buyer | Sale Price | Title Company |
|---|---|---|---|
| Red Rental Group Llc | -- | -- | |
| Shellman Shawn D | -- | Land Exchange Abstract & Tit |
Source: Public Records
Mortgage History
| Date | Status | Borrower | Loan Amount |
|---|---|---|---|
| Open | Shellman Shawn D | $116,451 |
Source: Public Records
Tax History
| Year | Tax Paid | Tax Assessment Tax Assessment Total Assessment is a certain percentage of the fair market value that is determined by local assessors to be the total taxable value of land and additions on the property. | Land | Improvement |
|---|---|---|---|---|
| 2025 | $2,734 | $188,500 | -- | -- |
| 2024 | $2,640 | $188,500 | -- | -- |
| 2023 | $2,167 | $171,364 | $0 | $0 |
| 2022 | $3,279 | $155,785 | $0 | $0 |
| 2021 | $3,403 | $141,623 | $25,000 | $116,623 |
| 2020 | $3,388 | $135,755 | $25,000 | $110,755 |
| 2019 | $3,216 | $122,138 | $10,650 | $111,488 |
| 2018 | $2,756 | $112,262 | $10,650 | $101,612 |
| 2017 | $2,843 | $115,212 | $10,650 | $104,562 |
| 2016 | $2,587 | $104,836 | $10,650 | $94,186 |
| 2014 | $2,410 | $97,605 | $0 | $0 |
Source: Public Records
Map
Nearby Homes
- 805 James Loop
- 804 James Loop
- 5211 Capricorn Loop
- 513 Draco Dr
- 902 Draco Dr
- 5301 Lyra Dr
- 5200 Milky Way Ave
- 5004 Lindsey Dr
- 4803 Chad Dr
- 510 Perseus
- 506 Perseus
- 503 E Gemini Ln
- 4909 Mikey Dr
- 1303 Nicholas Cir
- 1305 Nicholas Cir
- 602 Taurus Dr
- 1307 Nicholas Cir
- 401 James Loop
- 612 Constellation Dr
- 306 E Vega Ln
Your Personal Tour Guide
Ask me questions while you tour the home.