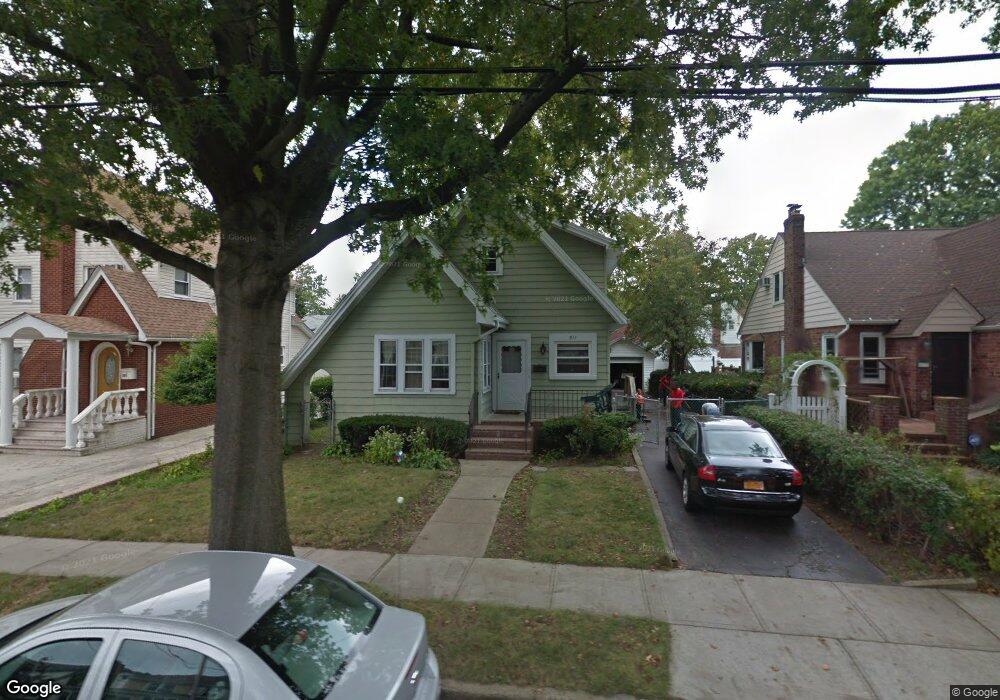
811 Linden Ave North Baldwin, NY 11510
Estimated Value: $598,000 - $648,177
3
Beds
3
Baths
1,152
Sq Ft
$541/Sq Ft
Est. Value
About This Home
This home is located at 811 Linden Ave, North Baldwin, NY 11510 and is currently estimated at $623,089, approximately $540 per square foot. 811 Linden Ave is a home located in Nassau County with nearby schools including Baldwin Senior High School, Roosevelt Children's Academy, and Sacred Heart School.
Ownership History
Date
Name
Owned For
Owner Type
Purchase Details
Closed on
Jan 18, 2017
Sold by
Cesar Ana M
Bought by
Flores Alvaro E
Current Estimated Value
Home Financials for this Owner
Home Financials are based on the most recent Mortgage that was taken out on this home.
Original Mortgage
$313,500
Outstanding Balance
$259,670
Interest Rate
4.3%
Mortgage Type
New Conventional
Estimated Equity
$363,419
Purchase Details
Closed on
May 27, 2016
Sold by
Cesar Jnjacques P and Cesar Ana M
Bought by
Cesar Ana M
Purchase Details
Closed on
Apr 20, 2011
Sold by
Loeser Pamela and Ryan Patricia
Bought by
Cesar Jnjacques P and Cesar Ana M
Home Financials for this Owner
Home Financials are based on the most recent Mortgage that was taken out on this home.
Original Mortgage
$260,504
Interest Rate
4.62%
Mortgage Type
FHA
Purchase Details
Closed on
May 18, 2006
Sold by
Burford Sue
Create a Home Valuation Report for This Property
The Home Valuation Report is an in-depth analysis detailing your home's value as well as a comparison with similar homes in the area
Home Values in the Area
Average Home Value in this Area
Purchase History
| Date | Buyer | Sale Price | Title Company |
|---|---|---|---|
| Flores Alvaro E | $330,000 | First American Title Insuran | |
| Cesar Ana M | -- | Commonwealth Land Title Insu | |
| Cesar Jnjacques P | $271,500 | -- | |
| -- | -- | -- |
Source: Public Records
Mortgage History
| Date | Status | Borrower | Loan Amount |
|---|---|---|---|
| Open | Flores Alvaro E | $313,500 | |
| Previous Owner | Cesar Jnjacques P | $260,504 |
Source: Public Records
Tax History Compared to Growth
Tax History
| Year | Tax Paid | Tax Assessment Tax Assessment Total Assessment is a certain percentage of the fair market value that is determined by local assessors to be the total taxable value of land and additions on the property. | Land | Improvement |
|---|---|---|---|---|
| 2025 | $10,301 | $350 | $144 | $206 |
| 2024 | $2,571 | $350 | $144 | $206 |
| 2023 | $9,691 | $360 | $148 | $212 |
| 2022 | $9,691 | $350 | $144 | $206 |
| 2021 | $12,493 | $350 | $116 | $234 |
| 2020 | $10,414 | $667 | $510 | $157 |
| 2019 | $12,989 | $667 | $510 | $157 |
| 2018 | $12,318 | $667 | $0 | $0 |
| 2017 | $6,531 | $667 | $510 | $157 |
| 2016 | $9,745 | $667 | $510 | $157 |
| 2015 | $3,051 | $667 | $510 | $157 |
| 2014 | $3,051 | $667 | $510 | $157 |
| 2013 | $2,857 | $667 | $510 | $157 |
Source: Public Records
Map
Nearby Homes
- 840 Kings Pkwy
- 1600 Grand Ave Unit V1
- 1690 Grand Ave Unit A16
- 1690 Grand Ave Unit B14
- 915 Wallace Ave
- 1535 Mattison St
- 723 William St
- 685 John St
- 4 Robert Place
- 1476 Kingston Ave
- 700 W Carl Ave
- 1449 Grand Ave
- 1515 Paul St
- 1014 Kings Pkwy
- 712 Demott Ave
- 1459 Prince St
- 1850 Voshage St
- 1477 Wales Ave
- 1420 Grand Ave
- 2 Twain St
- 817 Linden Ave
- 809 Linden Ave
- 823 Linden Ave
- 803 Linden Ave
- 810 Wallace Ave
- 810 Wallace Ave
- 814 Wallace Ave
- 800 Wallace Ave
- 814 Linden Ave
- 810 Linden Ave
- 818 Linden Ave
- 829 Linden Ave
- 820 Wallace Ave
- 806 Linden Ave
- 12 Linden Ave
- 794 Wallace Ave
- 14 Linden Ave
- 835 Linden Ave
- 1625 Grand Ave
- 1621 Grand Ave