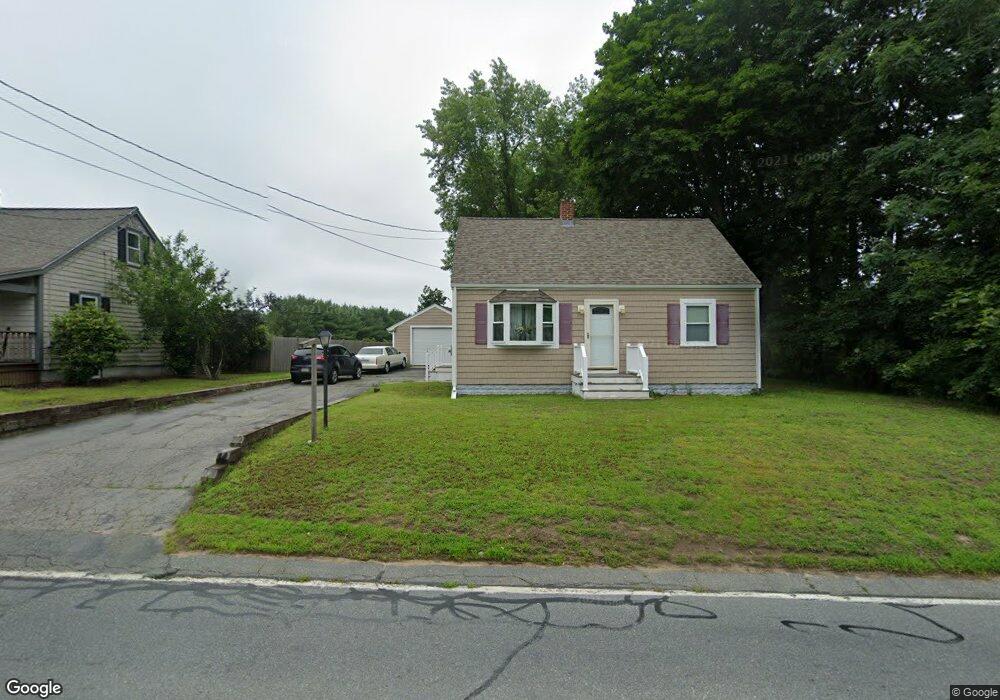
811 Main St Acushnet, MA 02743
Upper Acushnet NeighborhoodEstimated Value: $610,000 - $704,000
Studio
1
Bath
2,332
Sq Ft
$281/Sq Ft
Est. Value
About This Home
This home is located at 811 Main St, Acushnet, MA 02743 and is currently estimated at $654,893, approximately $280 per square foot. 811 Main St is a home located in Bristol County with nearby schools including Acushnet Elementary School, Albert F Ford Middle School, and Alma Del Mar Charter School.
Ownership History
Date
Name
Owned For
Owner Type
Purchase Details
Closed on
Jun 28, 1990
Sold by
L F Rt
Bought by
Krupa Jeffrey A
Current Estimated Value
Home Financials for this Owner
Home Financials are based on the most recent Mortgage that was taken out on this home.
Original Mortgage
$112,000
Interest Rate
10.27%
Mortgage Type
Purchase Money Mortgage
Create a Home Valuation Report for This Property
The Home Valuation Report is an in-depth analysis detailing your home's value as well as a comparison with similar homes in the area
Home Values in the Area
Average Home Value in this Area
Purchase History
| Date | Buyer | Sale Price | Title Company |
|---|---|---|---|
| Krupa Jeffrey A | $89,900 | -- |
Source: Public Records
Mortgage History
| Date | Status | Borrower | Loan Amount |
|---|---|---|---|
| Open | Krupa Jeffrey A | $130,000 | |
| Closed | Krupa Jeffrey A | $113,000 | |
| Closed | Krupa Jeffrey A | $112,000 |
Source: Public Records
Tax History
| Year | Tax Paid | Tax Assessment Tax Assessment Total Assessment is a certain percentage of the fair market value that is determined by local assessors to be the total taxable value of land and additions on the property. | Land | Improvement |
|---|---|---|---|---|
| 2025 | $56 | $514,600 | $171,600 | $343,000 |
| 2024 | $5,532 | $484,800 | $162,600 | $322,200 |
| 2023 | $5,449 | $454,100 | $147,500 | $306,600 |
| 2022 | $4,946 | $372,700 | $138,500 | $234,200 |
| 2021 | $5,071 | $366,700 | $138,500 | $228,200 |
| 2020 | $4,986 | $357,700 | $129,500 | $228,200 |
| 2019 | $4,952 | $349,200 | $123,500 | $225,700 |
| 2018 | $4,710 | $326,600 | $123,500 | $203,100 |
| 2017 | $4,589 | $317,800 | $123,500 | $194,300 |
| 2016 | $4,392 | $302,300 | $123,500 | $178,800 |
| 2015 | $4,050 | $283,600 | $123,500 | $160,100 |
Source: Public Records
Map
Nearby Homes
- 0 Land Way Unit 73479153
- 489 Main St
- 363 Main St
- 0 Keene Rd Unit 73459818
- 329 Middle Rd
- 25 Pershing Ave
- 23 Oliveira Ave
- 191 Hathaway Rd
- 7 Hamlin St
- 168 Keene Rd
- 199 Quaker Ln
- 0 Hathaway Rd Unit 73469544
- 12 White St
- 1015 Forbes St
- 973 Pembroke St
- 23 Coury Dr
- 40 Foley Dr
- SS Charbonneau Ln
- ES Acushnet Ave
- Lot 3 Beverly St
Your Personal Tour Guide
Ask me questions while you tour the home.