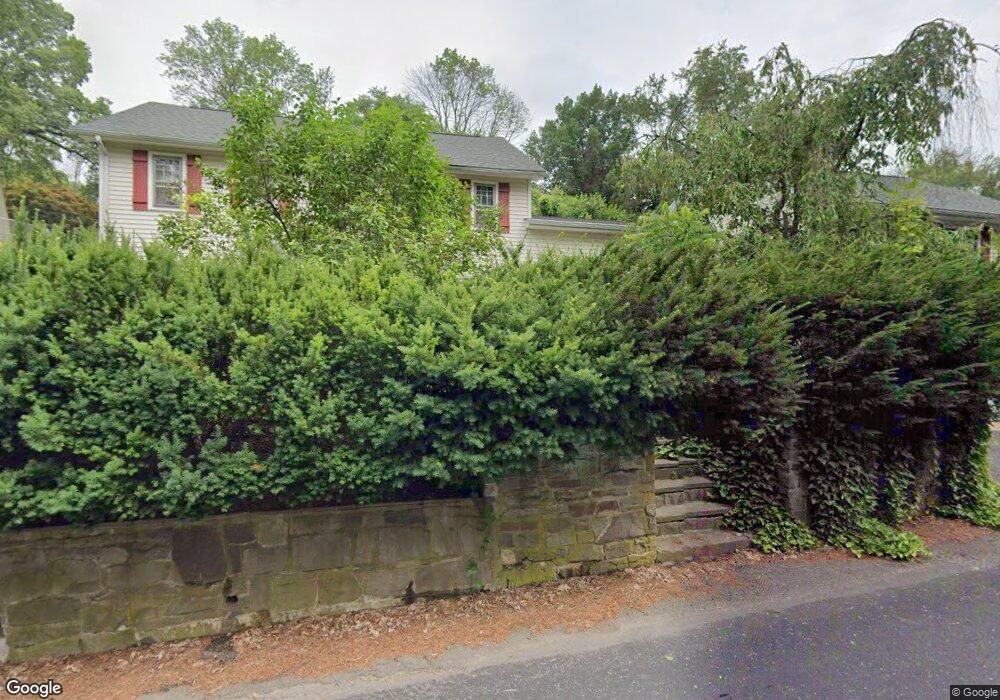
811 Mill Ln Hillsborough, NJ 08844
Estimated Value: $687,091 - $812,000
--
Bed
--
Bath
2,840
Sq Ft
$263/Sq Ft
Est. Value
About This Home
This home is located at 811 Mill Ln, Hillsborough, NJ 08844 and is currently estimated at $745,523, approximately $262 per square foot. 811 Mill Ln is a home located in Somerset County with nearby schools including Hillsborough High School and Cherry Blossom Montessori School.
Ownership History
Date
Name
Owned For
Owner Type
Purchase Details
Closed on
Jun 9, 2010
Sold by
Kurman Marianne
Bought by
Kingsland Matthew L and Kingsland Melissa J
Current Estimated Value
Home Financials for this Owner
Home Financials are based on the most recent Mortgage that was taken out on this home.
Original Mortgage
$244,200
Outstanding Balance
$164,784
Interest Rate
5.11%
Mortgage Type
FHA
Estimated Equity
$580,739
Create a Home Valuation Report for This Property
The Home Valuation Report is an in-depth analysis detailing your home's value as well as a comparison with similar homes in the area
Home Values in the Area
Average Home Value in this Area
Purchase History
| Date | Buyer | Sale Price | Title Company |
|---|---|---|---|
| Kingsland Matthew L | $260,000 | None Available |
Source: Public Records
Mortgage History
| Date | Status | Borrower | Loan Amount |
|---|---|---|---|
| Open | Kingsland Matthew L | $244,200 |
Source: Public Records
Tax History Compared to Growth
Tax History
| Year | Tax Paid | Tax Assessment Tax Assessment Total Assessment is a certain percentage of the fair market value that is determined by local assessors to be the total taxable value of land and additions on the property. | Land | Improvement |
|---|---|---|---|---|
| 2025 | $11,131 | $576,900 | $258,500 | $318,400 |
| 2024 | $11,131 | $519,400 | $253,500 | $265,900 |
| 2023 | $9,271 | $430,600 | $193,500 | $237,100 |
| 2022 | $9,314 | $417,100 | $178,500 | $238,600 |
| 2021 | $9,089 | $387,100 | $148,500 | $238,600 |
| 2020 | $9,150 | $383,800 | $143,500 | $240,300 |
| 2019 | $9,267 | $385,500 | $143,500 | $242,000 |
| 2018 | $8,989 | $371,600 | $128,500 | $243,100 |
| 2017 | $8,774 | $363,300 | $118,500 | $244,800 |
| 2016 | $8,811 | $365,000 | $118,500 | $246,500 |
| 2015 | $7,717 | $323,700 | $118,500 | $205,200 |
| 2014 | $6,274 | $268,800 | $103,500 | $165,300 |
Source: Public Records
Map
Nearby Homes