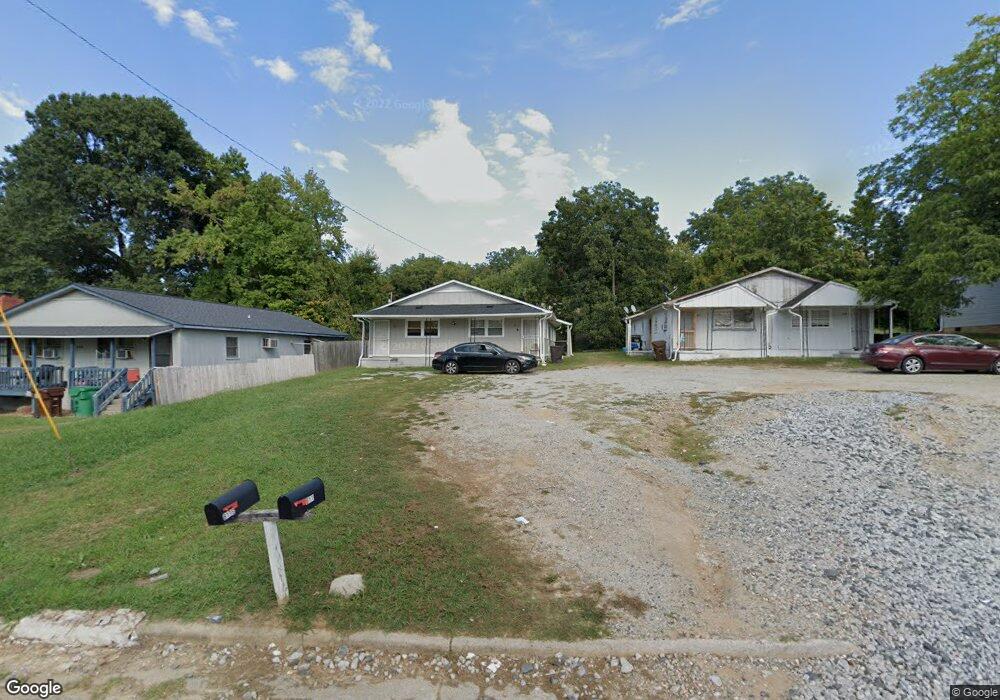
811 Mobile St Unit A&B High Point, NC 27260
Greater High Point NeighborhoodEstimated Value: $129,000 - $166,000
4
Beds
2
Baths
1,600
Sq Ft
$89/Sq Ft
Est. Value
About This Home
This home is located at 811 Mobile St Unit A&B, High Point, NC 27260 and is currently estimated at $142,855, approximately $89 per square foot. 811 Mobile St Unit A&B is a home located in Guilford County with nearby schools including Fairview Elementary School, Ferndale Middle School, and High Point Central High School.
Ownership History
Date
Name
Owned For
Owner Type
Purchase Details
Closed on
Oct 4, 2021
Sold by
Khan Jaber and Khan Aneela
Bought by
Set 24 Realty Llc
Current Estimated Value
Purchase Details
Closed on
Apr 25, 2019
Sold by
Muhammad Irshad and Khan Rifhat
Bought by
Khan Jaber
Purchase Details
Closed on
Jul 25, 2017
Sold by
White Kessler Funding Group Trust
Bought by
Irshad Muhammad
Purchase Details
Closed on
Jun 14, 2017
Sold by
Bethea Jonnnie and Bethea Kisha R
Bought by
White & Kessler Funding Group Trust
Purchase Details
Closed on
Aug 29, 2006
Sold by
Bruce Daphne L and Bruce Everett
Bought by
Bethea Johnnie and Bethea Kisha R
Home Financials for this Owner
Home Financials are based on the most recent Mortgage that was taken out on this home.
Original Mortgage
$29,640
Interest Rate
6.67%
Mortgage Type
Construction
Create a Home Valuation Report for This Property
The Home Valuation Report is an in-depth analysis detailing your home's value as well as a comparison with similar homes in the area
Home Values in the Area
Average Home Value in this Area
Purchase History
| Date | Buyer | Sale Price | Title Company |
|---|---|---|---|
| Set 24 Realty Llc | $85,000 | None Available | |
| Khan Jaber | -- | None Available | |
| Irshad Muhammad | $18,000 | None Available | |
| White & Kessler Funding Group Trust | $14,000 | None Available | |
| Bethea Johnnie | $18,000 | Nations Title Agency Of The |
Source: Public Records
Mortgage History
| Date | Status | Borrower | Loan Amount |
|---|---|---|---|
| Previous Owner | Bethea Johnnie | $29,640 |
Source: Public Records
Tax History Compared to Growth
Tax History
| Year | Tax Paid | Tax Assessment Tax Assessment Total Assessment is a certain percentage of the fair market value that is determined by local assessors to be the total taxable value of land and additions on the property. | Land | Improvement |
|---|---|---|---|---|
| 2025 | $1,232 | $89,400 | $12,000 | $77,400 |
| 2024 | $1,232 | $89,400 | $12,000 | $77,400 |
| 2023 | $1,232 | $89,400 | $12,000 | $77,400 |
| 2022 | $1,205 | $89,400 | $12,000 | $77,400 |
| 2021 | $1,253 | $71,000 | $8,500 | $62,500 |
| 2020 | $978 | $71,000 | $8,500 | $62,500 |
| 2019 | $978 | $71,000 | $0 | $0 |
| 2018 | $974 | $71,000 | $0 | $0 |
| 2017 | $974 | $71,000 | $0 | $0 |
| 2016 | $986 | $70,300 | $0 | $0 |
| 2015 | $991 | $70,300 | $0 | $0 |
| 2014 | $1,008 | $70,300 | $0 | $0 |
Source: Public Records
Map
Nearby Homes
- 608 Vail Ave
- 711 Fairview St
- 800 George Place
- 712 Cliffside Ave
- 801 Amos St
- 703 Langford Ave
- 616 S Elm St
- 800 Cliffside Ave
- 523 Cross St
- 816 Tryon Ave
- 527 Amos St
- 525 Amos St
- 1217 Cloverdale St
- 328 Ennis St
- 1309 S Elm St
- 604 W Ward Ave
- 1113 Young Place
- 915 Park St
- 4304 Griffins Gate Ln
- 113 Briggs Place