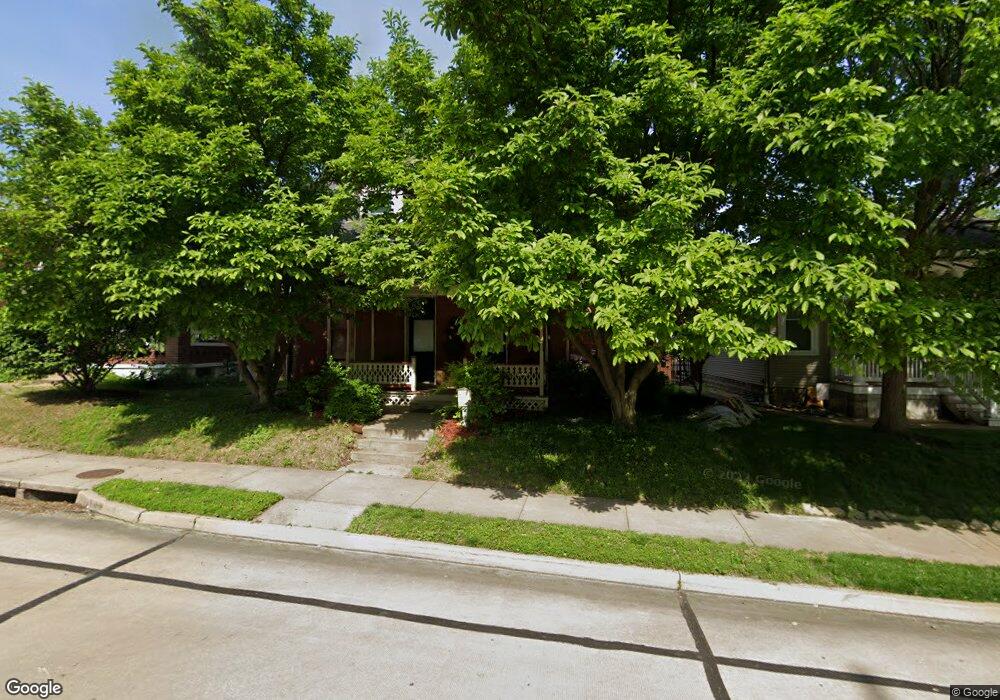
811 N 5th St Saint Charles, MO 63301
Old Town Saint Charles NeighborhoodEstimated Value: $292,000 - $388,000
3
Beds
3
Baths
1,533
Sq Ft
$218/Sq Ft
Est. Value
About This Home
This home is located at 811 N 5th St, Saint Charles, MO 63301 and is currently estimated at $334,454, approximately $218 per square foot. 811 N 5th St is a home located in St. Charles County with nearby schools including Blackhurst Elementary School, Hardin Middle School, and Jefferson Intermediate School.
Ownership History
Date
Name
Owned For
Owner Type
Purchase Details
Closed on
Nov 3, 2025
Sold by
Lohaus Kelly L
Bought by
Lohaus Christopher M
Current Estimated Value
Home Financials for this Owner
Home Financials are based on the most recent Mortgage that was taken out on this home.
Original Mortgage
$114,000
Outstanding Balance
$114,000
Interest Rate
6.3%
Mortgage Type
New Conventional
Estimated Equity
$220,454
Purchase Details
Closed on
Aug 22, 2008
Sold by
Lawrence John O and Lawrence Wendy M
Bought by
Lohaus Christopher M and Lohaus Kelly L
Home Financials for this Owner
Home Financials are based on the most recent Mortgage that was taken out on this home.
Original Mortgage
$209,000
Interest Rate
6.42%
Mortgage Type
Purchase Money Mortgage
Purchase Details
Closed on
Oct 10, 2006
Sold by
Phelps Dolores M and Survivors Trust Subshare Of Th
Bought by
Lawrence John O and Lawrence Wendy M
Home Financials for this Owner
Home Financials are based on the most recent Mortgage that was taken out on this home.
Original Mortgage
$185,250
Interest Rate
6.46%
Mortgage Type
Purchase Money Mortgage
Purchase Details
Closed on
Jun 6, 2006
Sold by
Phelps Dolores M
Bought by
Phelps Dolores M and Dale Roy C
Create a Home Valuation Report for This Property
The Home Valuation Report is an in-depth analysis detailing your home's value as well as a comparison with similar homes in the area
Home Values in the Area
Average Home Value in this Area
Purchase History
| Date | Buyer | Sale Price | Title Company |
|---|---|---|---|
| Lohaus Christopher M | -- | Old Republic Title | |
| Lohaus Christopher M | $220,000 | Ust | |
| Lawrence John O | -- | Investors Title Company | |
| Phelps Dolores M | -- | None Available |
Source: Public Records
Mortgage History
| Date | Status | Borrower | Loan Amount |
|---|---|---|---|
| Open | Lohaus Christopher M | $114,000 | |
| Previous Owner | Lohaus Christopher M | $209,000 | |
| Previous Owner | Lawrence John O | $185,250 |
Source: Public Records
Tax History
| Year | Tax Paid | Tax Assessment Tax Assessment Total Assessment is a certain percentage of the fair market value that is determined by local assessors to be the total taxable value of land and additions on the property. | Land | Improvement |
|---|---|---|---|---|
| 2025 | $3,292 | $53,817 | -- | -- |
| 2023 | $3,286 | $51,284 | $0 | $0 |
| 2022 | $3,022 | $43,971 | $0 | $0 |
| 2021 | $3,026 | $43,971 | $0 | $0 |
| 2020 | $3,137 | $43,837 | $0 | $0 |
| 2019 | $3,109 | $43,837 | $0 | $0 |
| 2018 | $2,849 | $38,162 | $0 | $0 |
| 2017 | $2,810 | $38,162 | $0 | $0 |
| 2016 | $2,681 | $35,061 | $0 | $0 |
| 2015 | $2,676 | $35,061 | $0 | $0 |
| 2014 | $2,718 | $35,154 | $0 | $0 |
Source: Public Records
Map
Nearby Homes
- 917 N 5th St
- 723 N 7th St
- 1200 N Benton Ave
- 502 N 7th St
- 407 N 7th St
- 625 Adams St
- 1411 N 2nd St
- 221 N Benton Ave
- 1913 Park Ave
- 68 Barton Place
- 917 Hawthorn Ave
- 45 Saint Leonard Ct
- 417 Jackson St
- 626 Tompkins St
- 2203 W Adams St
- 1 Canterbury @ Kreder Farms
- 155 Palais Ct
- 808 S 6th St
- 1117 Tompkins St
- 324 Elmwood Dr
Your Personal Tour Guide
Ask me questions while you tour the home.