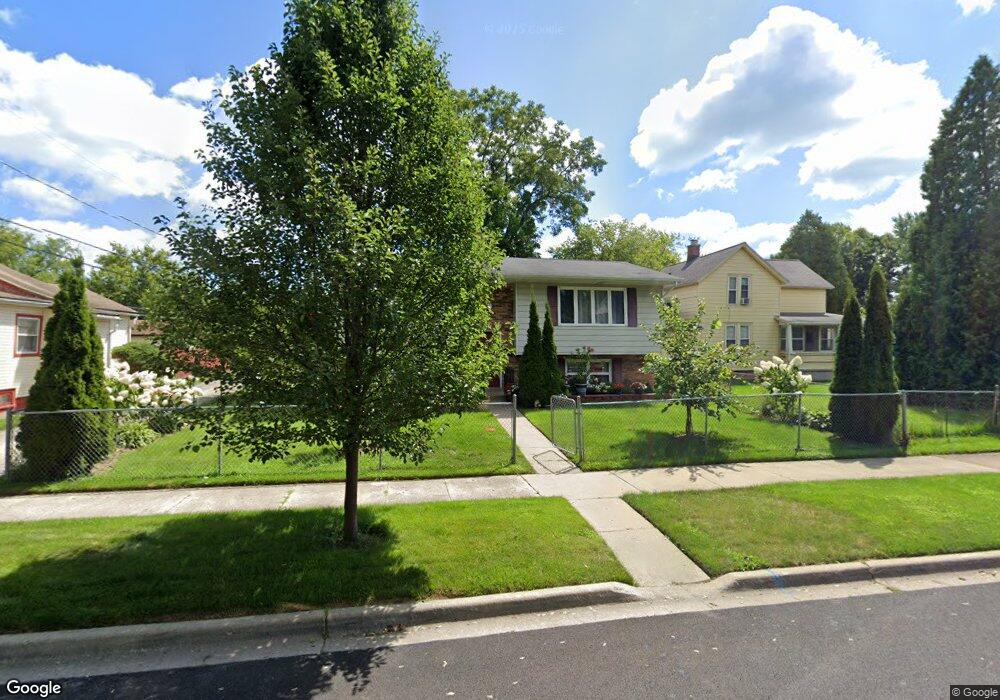
811 N Ash St Waukegan, IL 60085
Estimated Value: $217,000 - $286,000
4
Beds
2
Baths
1,976
Sq Ft
$125/Sq Ft
Est. Value
About This Home
This home is located at 811 N Ash St, Waukegan, IL 60085 and is currently estimated at $246,833, approximately $124 per square foot. 811 N Ash St is a home located in Lake County with nearby schools including Edith M Smith Middle School, Waukegan High School, and LEARN John & Kathy Schreiber Campus.
Ownership History
Date
Name
Owned For
Owner Type
Purchase Details
Closed on
Jul 1, 2011
Sold by
Munroe Sonja K
Bought by
Perez Alejandro and Noyola Rosibel
Current Estimated Value
Home Financials for this Owner
Home Financials are based on the most recent Mortgage that was taken out on this home.
Original Mortgage
$96,289
Outstanding Balance
$66,306
Interest Rate
4.53%
Mortgage Type
Purchase Money Mortgage
Estimated Equity
$180,527
Create a Home Valuation Report for This Property
The Home Valuation Report is an in-depth analysis detailing your home's value as well as a comparison with similar homes in the area
Home Values in the Area
Average Home Value in this Area
Purchase History
| Date | Buyer | Sale Price | Title Company |
|---|---|---|---|
| Perez Alejandro | $107,000 | Multiple |
Source: Public Records
Mortgage History
| Date | Status | Borrower | Loan Amount |
|---|---|---|---|
| Open | Perez Alejandro | $96,289 |
Source: Public Records
Tax History Compared to Growth
Tax History
| Year | Tax Paid | Tax Assessment Tax Assessment Total Assessment is a certain percentage of the fair market value that is determined by local assessors to be the total taxable value of land and additions on the property. | Land | Improvement |
|---|---|---|---|---|
| 2024 | $5,003 | $67,756 | $7,527 | $60,229 |
| 2023 | $5,497 | $61,058 | $6,739 | $54,319 |
| 2022 | $5,497 | $62,229 | $6,410 | $55,819 |
| 2021 | $5,148 | $55,377 | $5,718 | $49,659 |
| 2020 | $5,168 | $51,590 | $5,327 | $46,263 |
| 2019 | $5,148 | $47,274 | $4,881 | $42,393 |
| 2018 | $5,401 | $48,159 | $6,218 | $41,941 |
| 2017 | $5,207 | $42,607 | $5,501 | $37,106 |
| 2016 | $4,794 | $37,024 | $4,780 | $32,244 |
| 2015 | $4,584 | $33,137 | $4,278 | $28,859 |
| 2014 | $3,737 | $27,628 | $4,298 | $23,330 |
| 2012 | $4,852 | $29,931 | $4,656 | $25,275 |
Source: Public Records
Map
Nearby Homes
- 620 N Poplar St
- 702 Franklin St
- 918 N Ash St
- 522 N Poplar St
- 325 4th St
- 428 N Poplar St
- 511 Chestnut St
- 452 North Ave
- 415 W Ridgeland Ave
- 723 N County St
- 1110 N Ash St
- 917 N Linden Ave
- 1122 N Ash St
- 1109 Massena Ave
- 611 N Genesee St
- 217 Stewart Ave
- 1000 Pine St
- 824 N Butrick St
- 1105 Woodlawn Cir
- 222 Grand Ave