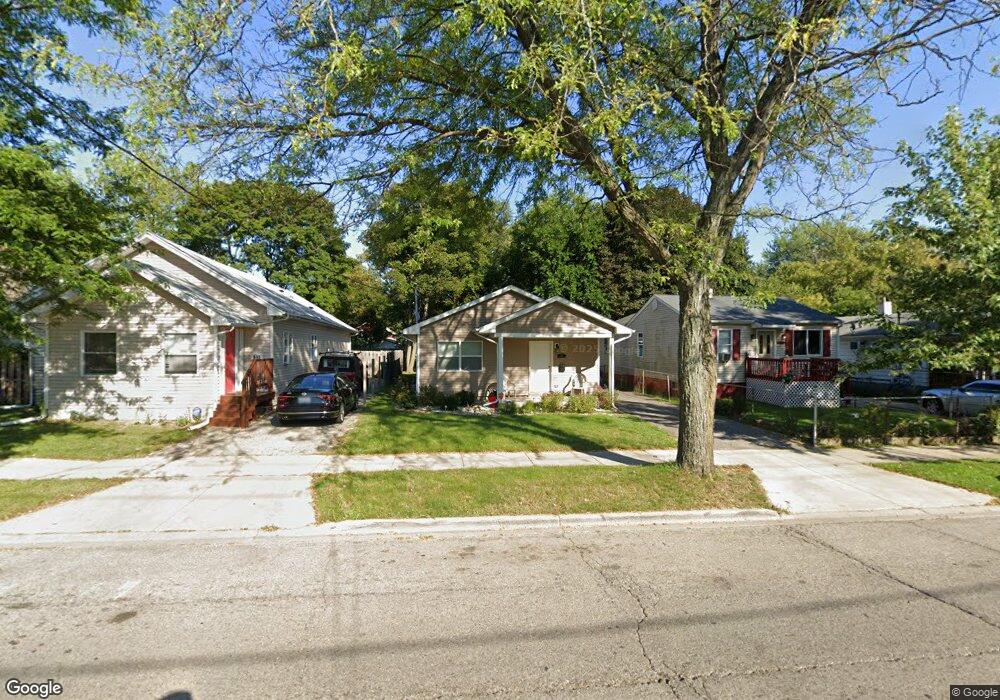
811 N Butrick St Waukegan, IL 60085
Waukegan Gardens NeighborhoodEstimated Value: $253,000 - $267,000
2
Beds
1
Bath
1,200
Sq Ft
$216/Sq Ft
Est. Value
About This Home
This home is located at 811 N Butrick St, Waukegan, IL 60085 and is currently estimated at $259,305, approximately $216 per square foot. 811 N Butrick St is a home located in Lake County with nearby schools including Whittier Elementary School, Edith M Smith Middle School, and Waukegan High School.
Ownership History
Date
Name
Owned For
Owner Type
Purchase Details
Closed on
Jun 21, 2017
Sold by
Habitat For Humanity Lake County Illinoi
Bought by
Hood Daveshira Erictae
Current Estimated Value
Home Financials for this Owner
Home Financials are based on the most recent Mortgage that was taken out on this home.
Original Mortgage
$66,471
Outstanding Balance
$45,167
Interest Rate
3.94%
Mortgage Type
Stand Alone First
Estimated Equity
$214,138
Purchase Details
Closed on
Mar 23, 2015
Sold by
Dixon Suquanda C and Dixon Gerald
Bought by
Habitat For Humanity Lake County Illinoi
Purchase Details
Closed on
Jan 15, 2015
Sold by
Gudger Letrece and Howard Letrece
Bought by
Dixon Suquanda
Purchase Details
Closed on
Dec 30, 2014
Sold by
Howard Letrehl
Bought by
Dixon Suquanda
Purchase Details
Closed on
Mar 20, 2002
Sold by
Howard Brenda
Bought by
Dixon Suquanda
Create a Home Valuation Report for This Property
The Home Valuation Report is an in-depth analysis detailing your home's value as well as a comparison with similar homes in the area
Home Values in the Area
Average Home Value in this Area
Purchase History
| Date | Buyer | Sale Price | Title Company |
|---|---|---|---|
| Hood Daveshira Erictae | $105,000 | None Available | |
| Habitat For Humanity Lake County Illinoi | -- | None Available | |
| Dixon Suquanda | -- | None Available | |
| Dixon Suquanda | -- | None Available | |
| Dixon Suquanda | -- | -- |
Source: Public Records
Mortgage History
| Date | Status | Borrower | Loan Amount |
|---|---|---|---|
| Open | Hood Daveshira Erictae | $66,471 |
Source: Public Records
Tax History Compared to Growth
Tax History
| Year | Tax Paid | Tax Assessment Tax Assessment Total Assessment is a certain percentage of the fair market value that is determined by local assessors to be the total taxable value of land and additions on the property. | Land | Improvement |
|---|---|---|---|---|
| 2024 | $5,872 | $77,723 | $8,952 | $68,771 |
| 2023 | $5,954 | $70,271 | $8,094 | $62,177 |
| 2022 | $5,954 | $66,906 | $6,354 | $60,552 |
| 2021 | $5,091 | $54,836 | $5,555 | $49,281 |
| 2020 | $5,111 | $51,086 | $5,175 | $45,911 |
| 2019 | $5,091 | $46,812 | $4,742 | $42,070 |
| 2018 | $3,301 | $31,910 | $5,967 | $25,943 |
| 2017 | $3,162 | $28,231 | $5,279 | $22,952 |
| 2016 | $2,938 | $25,012 | $4,588 | $20,424 |
| 2015 | $694 | $4,106 | $4,106 | $0 |
| 2014 | $1,212 | $12,701 | $3,068 | $9,633 |
| 2012 | $1,810 | $13,760 | $3,323 | $10,437 |
Source: Public Records
Map
Nearby Homes
- 824 N Butrick St
- 1000 Pine St
- 917 N Linden Ave
- 968 Judge Ave
- 509 N Butrick St
- 1105 Woodlawn Cir
- 1117 Judge Ave
- 620 N Poplar St
- 1038 Indiana Ave
- 1005 N Lewis Ave
- 1504 W Glen Flora Ave
- 702 Franklin St
- 1019 N Lewis Ave
- 522 N Poplar St
- 918 N Ash St
- 511 Chestnut St
- 1213 Grand Ave
- 428 N Poplar St
- 1110 N Ash St
- 1122 N Ash St
- 815 N Butrick St
- 809 N Butrick St
- 817 N Butrick St
- 805 N Butrick St
- 821 N Butrick St
- 801 N Butrick St
- 1317 Garden Place
- 812 Pine St
- 810 Pine St
- 825 N Butrick St
- 816 Pine St
- 725 N Butrick St
- 1309 Garden Place
- 804 Pine St
- 717 N Butrick St
- 820 N Butrick St
- 812 N Butrick St
- 816 N Butrick St
- 810 N Butrick St
- 722 Pine St