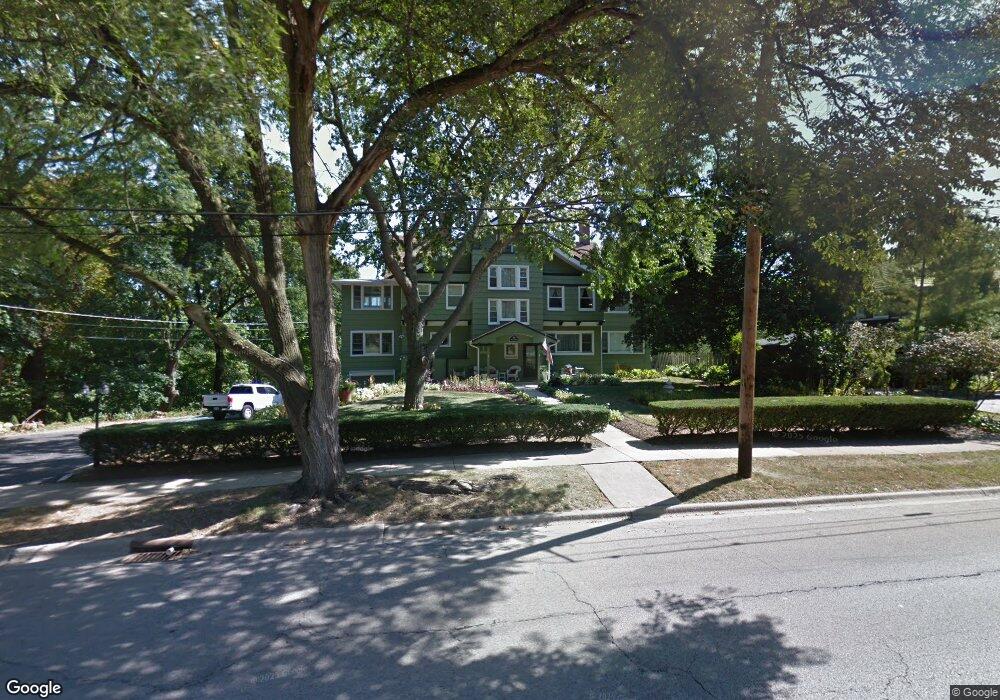
811 N Sheridan Rd Waukegan, IL 60085
Estimated Value: $387,000 - $501,000
6
Beds
4
Baths
3,036
Sq Ft
$149/Sq Ft
Est. Value
About This Home
This home is located at 811 N Sheridan Rd, Waukegan, IL 60085 and is currently estimated at $451,595, approximately $148 per square foot. 811 N Sheridan Rd is a home located in Lake County with nearby schools including Edith M Smith Middle School, Waukegan High School, and LEARN John & Kathy Schreiber Campus.
Ownership History
Date
Name
Owned For
Owner Type
Purchase Details
Closed on
Jul 24, 2022
Sold by
Martens Daniel M
Bought by
724 Mp Llc Series 6
Current Estimated Value
Purchase Details
Closed on
Sep 2, 2015
Sold by
Link Terry and Mccall Link Susan
Bought by
Martens Daniel M
Home Financials for this Owner
Home Financials are based on the most recent Mortgage that was taken out on this home.
Original Mortgage
$273,000
Interest Rate
4.12%
Mortgage Type
New Conventional
Purchase Details
Closed on
Apr 21, 2004
Sold by
Wesselhoft Charles W and Wesselhoft Marie R
Bought by
Link Terry and Mccall Link Susan
Home Financials for this Owner
Home Financials are based on the most recent Mortgage that was taken out on this home.
Original Mortgage
$256,000
Interest Rate
5.78%
Mortgage Type
Purchase Money Mortgage
Create a Home Valuation Report for This Property
The Home Valuation Report is an in-depth analysis detailing your home's value as well as a comparison with similar homes in the area
Home Values in the Area
Average Home Value in this Area
Purchase History
| Date | Buyer | Sale Price | Title Company |
|---|---|---|---|
| 724 Mp Llc Series 6 | $297,000 | Amy Ho Ltd | |
| Martens Daniel M | $390,000 | Ct | |
| Link Terry | $320,000 | Ticor Title Insurance Compan |
Source: Public Records
Mortgage History
| Date | Status | Borrower | Loan Amount |
|---|---|---|---|
| Previous Owner | Martens Daniel M | $273,000 | |
| Previous Owner | Link Terry | $256,000 |
Source: Public Records
Tax History Compared to Growth
Tax History
| Year | Tax Paid | Tax Assessment Tax Assessment Total Assessment is a certain percentage of the fair market value that is determined by local assessors to be the total taxable value of land and additions on the property. | Land | Improvement |
|---|---|---|---|---|
| 2024 | $12,593 | $147,809 | $37,556 | $110,253 |
| 2023 | $12,593 | $133,548 | $33,932 | $99,616 |
| 2022 | $13,814 | $147,302 | $49,781 | $97,521 |
| 2021 | $14,107 | $141,315 | $49,079 | $92,236 |
| 2020 | $14,243 | $131,652 | $45,723 | $85,929 |
| 2019 | $14,282 | $120,638 | $41,898 | $78,740 |
| 2018 | $13,469 | $110,556 | $40,239 | $70,317 |
| 2017 | $13,060 | $97,811 | $35,600 | $62,211 |
| 2016 | $10,692 | $75,189 | $30,936 | $44,253 |
| 2015 | $10,354 | $67,295 | $27,688 | $39,607 |
| 2014 | $10,075 | $65,092 | $25,200 | $39,892 |
| 2012 | $11,600 | $70,519 | $27,301 | $43,218 |
Source: Public Records
Map
Nearby Homes
- 723 N County St
- 611 N Genesee St
- 325 4th St
- 415 W Ridgeland Ave
- 452 North Ave
- 222 Grand Ave
- 918 N Ash St
- 620 N Poplar St
- 702 Franklin St
- 1110 N Ash St
- 522 N Poplar St
- 1122 N Ash St
- 428 N Poplar St
- 511 Chestnut St
- 1336 N Ash St
- 1335 Chestnut St
- 917 N Linden Ave
- 1109 Massena Ave
- 1613 North Ave
- 28 N Saint James St
- 721 N Sheridan Rd
- 717 N Sheridan Rd
- 831 N Sheridan Rd
- 713 N Sheridan Rd
- 709 N Sheridan Rd
- 837 N Sheridan Rd
- 703 N Sheridan Rd
- 710 N Sheridan Rd
- 719 N Genesee St
- 839 N Sheridan Rd
- 709 N Genesee St
- 635 N Sheridan Rd
- 836 N Sheridan Rd
- 702 N Sheridan Rd
- 634 N Sheridan Rd
- 629 N Sheridan Rd
- 217 Gillett Ave
- 907 N Sheridan Rd
- 720 N Genesee St
- 714 N Genesee St