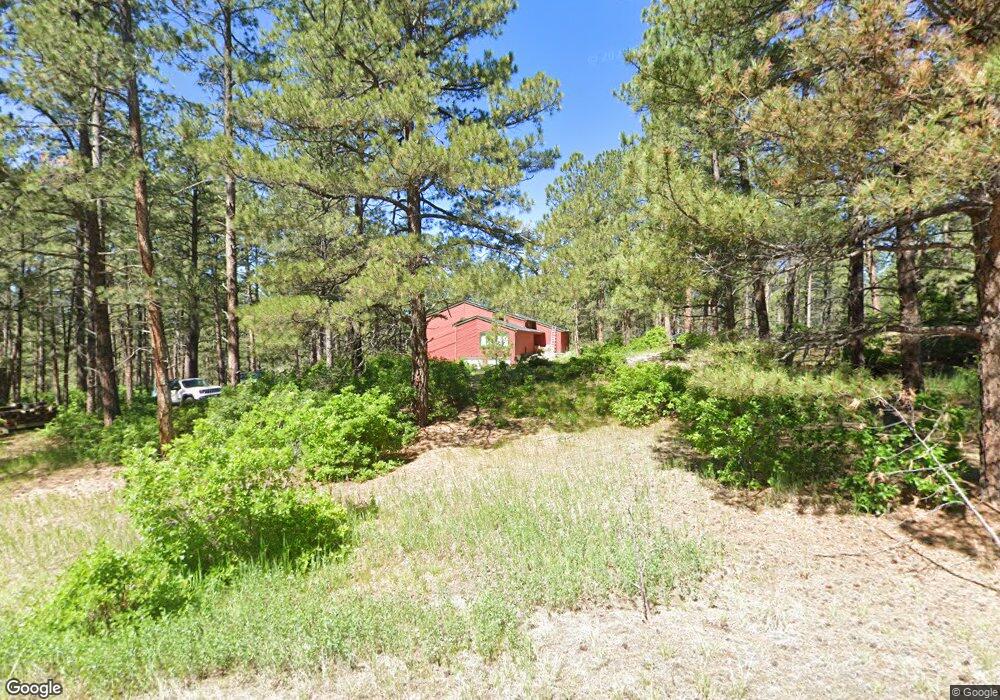
811 Nob Hill Trail Franktown, CO 80116
Estimated Value: $796,000 - $1,070,000
5
Beds
3
Baths
3,494
Sq Ft
$282/Sq Ft
Est. Value
About This Home
This home is located at 811 Nob Hill Trail, Franktown, CO 80116 and is currently estimated at $985,973, approximately $282 per square foot. 811 Nob Hill Trail is a home located in Douglas County with nearby schools including Franktown Elementary School, Sagewood Middle School, and Ponderosa High School.
Ownership History
Date
Name
Owned For
Owner Type
Purchase Details
Closed on
Nov 19, 2021
Sold by
Carter Sherry D
Bought by
Curtis Kc J and Curtis Larelin
Current Estimated Value
Home Financials for this Owner
Home Financials are based on the most recent Mortgage that was taken out on this home.
Original Mortgage
$844,965
Outstanding Balance
$774,908
Interest Rate
3.05%
Mortgage Type
VA
Estimated Equity
$211,065
Purchase Details
Closed on
Dec 13, 2010
Sold by
Walkup Steve and Fischer Michael Jordan
Bought by
Carter Sherry D
Home Financials for this Owner
Home Financials are based on the most recent Mortgage that was taken out on this home.
Original Mortgage
$264,115
Interest Rate
4.25%
Mortgage Type
FHA
Purchase Details
Closed on
Oct 21, 2010
Sold by
Westerra Credit Union
Bought by
Walkup Steve and Fischer Michael Jordan
Home Financials for this Owner
Home Financials are based on the most recent Mortgage that was taken out on this home.
Original Mortgage
$264,115
Interest Rate
4.25%
Mortgage Type
FHA
Purchase Details
Closed on
Apr 8, 2010
Sold by
Tauger Michael J and Wittman Cynthia S
Bought by
Westerra Credit Union
Purchase Details
Closed on
Sep 28, 2009
Sold by
Wittman Cynthia S and Tauger Cynthia S Wittman
Bought by
Tauger Michael J
Purchase Details
Closed on
May 22, 2002
Sold by
Chan William S and Chan Michelle Fanto
Bought by
Tauger Michael J and Wittman Cynthia A
Home Financials for this Owner
Home Financials are based on the most recent Mortgage that was taken out on this home.
Original Mortgage
$306,000
Interest Rate
6.75%
Purchase Details
Closed on
May 20, 2002
Sold by
Chan William S and Fanto Chan Michelle
Bought by
Tauger Michael J and Wittman Cynthia S
Home Financials for this Owner
Home Financials are based on the most recent Mortgage that was taken out on this home.
Original Mortgage
$306,000
Interest Rate
6.75%
Purchase Details
Closed on
Jul 28, 1995
Sold by
Peart Timothy R and Peart Janet P
Bought by
Chan William S and Fanto Chan Michelle
Home Financials for this Owner
Home Financials are based on the most recent Mortgage that was taken out on this home.
Original Mortgage
$242,350
Interest Rate
7.51%
Purchase Details
Closed on
Aug 9, 1985
Sold by
Hitch Land & Cattle Co
Bought by
Windfield Homes Timothy R Peart & Janet
Create a Home Valuation Report for This Property
The Home Valuation Report is an in-depth analysis detailing your home's value as well as a comparison with similar homes in the area
Home Values in the Area
Average Home Value in this Area
Purchase History
| Date | Buyer | Sale Price | Title Company |
|---|---|---|---|
| Curtis Kc J | $875,000 | Ascendant Natl Ttl Co Llc | |
| Carter Sherry D | $281,500 | Land Title Guarantee Company | |
| Walkup Steve | $235,000 | Land Title Guarantee Company | |
| Westerra Credit Union | -- | None Available | |
| Tauger Michael J | -- | None Available | |
| Tauger Michael J | $382,500 | -- | |
| Tauger Michael J | $382,500 | -- | |
| Chan William S | $269,300 | Land Title | |
| Windfield Homes Timothy R Peart & Janet | $36,800 | -- |
Source: Public Records
Mortgage History
| Date | Status | Borrower | Loan Amount |
|---|---|---|---|
| Open | Curtis Kc J | $844,965 | |
| Previous Owner | Carter Sherry D | $264,115 | |
| Previous Owner | Tauger Michael J | $306,000 | |
| Previous Owner | Chan William S | $242,350 |
Source: Public Records
Tax History Compared to Growth
Tax History
| Year | Tax Paid | Tax Assessment Tax Assessment Total Assessment is a certain percentage of the fair market value that is determined by local assessors to be the total taxable value of land and additions on the property. | Land | Improvement |
|---|---|---|---|---|
| 2024 | $5,613 | $68,810 | $36,080 | $32,730 |
| 2023 | $5,676 | $68,810 | $36,080 | $32,730 |
| 2022 | $4,008 | $47,870 | $24,570 | $23,300 |
| 2021 | $4,154 | $47,870 | $24,570 | $23,300 |
| 2020 | $3,734 | $44,040 | $20,470 | $23,570 |
| 2019 | $3,752 | $44,040 | $20,470 | $23,570 |
| 2018 | $3,299 | $38,040 | $16,760 | $21,280 |
| 2017 | $3,072 | $38,040 | $16,760 | $21,280 |
| 2016 | $2,983 | $36,220 | $15,200 | $21,020 |
| 2015 | $3,050 | $36,220 | $15,200 | $21,020 |
| 2014 | $2,546 | $28,250 | $9,150 | $19,100 |
Source: Public Records
Map
Nearby Homes
- 11044 Conestoga Place
- 230 S Big Meadow Trail
- 10525 Wild Fox Place
- 1559 Apex Rd
- 1750 Arrowpoint Ct
- 1721 Arrowpoint Ct
- 1724 Arrowpoint Ct
- 856 Woodridge Rd
- 104 Bill Davis Rd
- 1571 Arrowpoint Ct
- 1561 Arrowpoint Ct
- 1555 Arrowpoint Ct
- 11584 E State Highway 86
- 1133 Tomichi Dr
- 1341 Tomichi Dr
- 1972 Gold Camp Way
- 720 N Bluff Dr
- 11008 Sunset Oaks Place
- 11011 Sunset Oaks
- 191 Rocky Cliff Rd
- 10593 Pine Valley Dr
- 852 Nob Hill Trail
- 10481 Pine Valley Dr
- 901 Nob Hill Trail
- 812 Nob Hill Trail
- 772 Nob Hill Trail
- 892 Nob Hill Trail
- 731 Nob Hill Trail
- 732 Nob Hill Trail
- 10533 Pine Valley Dr
- 751 Nob Hill Trail
- 652 Nob Hill Trail
- 10564 Pine Valley Dr
- 932 Nob Hill Trail
- 10473 Pine Valley Dr
- 492 Nob Hill Trail
- 532 Nob Hill Trail
- 692 Nob Hill Trail
- 10455 Reindeer Cir
- 762 Red Deer Rd