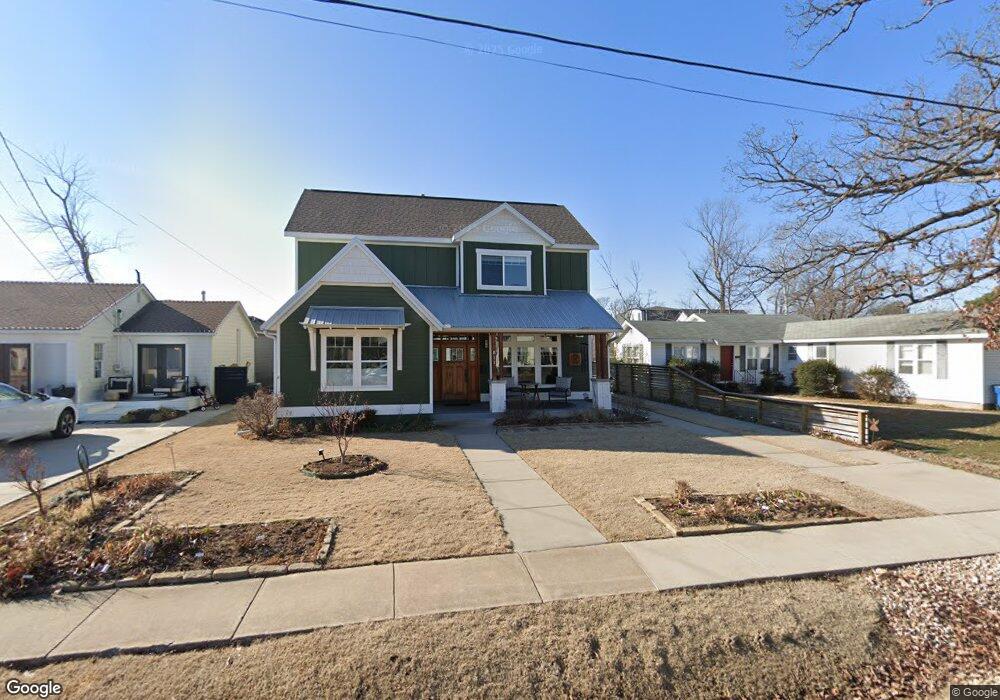
811 NW A St Bentonville, AR 72712
Estimated Value: $1,220,000 - $1,432,000
--
Bed
1
Bath
3,124
Sq Ft
$429/Sq Ft
Est. Value
About This Home
This home is located at 811 NW A St, Bentonville, AR 72712 and is currently estimated at $1,339,008, approximately $428 per square foot. 811 NW A St is a home located in Benton County with nearby schools including Sugar Creek Elementary School, Lincoln Junior High School, and Old High Middle School.
Ownership History
Date
Name
Owned For
Owner Type
Purchase Details
Closed on
Jan 11, 2005
Sold by
Lipscomb Bernice M
Bought by
Kenyon Timothy and Kenyon Elizabeth J
Current Estimated Value
Purchase Details
Closed on
Oct 26, 2004
Sold by
Lipscomb Bernice M
Bought by
Kenyon Timothy and Kenyon Elizabeth J
Purchase Details
Closed on
Aug 31, 1994
Bought by
Kenyon
Purchase Details
Closed on
Aug 29, 1986
Bought by
Dod 08-29-1986
Create a Home Valuation Report for This Property
The Home Valuation Report is an in-depth analysis detailing your home's value as well as a comparison with similar homes in the area
Home Values in the Area
Average Home Value in this Area
Purchase History
| Date | Buyer | Sale Price | Title Company |
|---|---|---|---|
| Kenyon Timothy | $40,000 | None Available | |
| Kenyon Timothy | $40,000 | None Available | |
| Kenyon | -- | -- | |
| Lipscomb Trust | -- | -- | |
| Dod 08-29-1986 | -- | -- |
Source: Public Records
Tax History Compared to Growth
Tax History
| Year | Tax Paid | Tax Assessment Tax Assessment Total Assessment is a certain percentage of the fair market value that is determined by local assessors to be the total taxable value of land and additions on the property. | Land | Improvement |
|---|---|---|---|---|
| 2025 | $3,788 | $258,070 | $76,832 | $181,238 |
| 2024 | $3,806 | $258,070 | $76,832 | $181,238 |
| 2023 | $3,806 | $136,880 | $45,470 | $91,410 |
| 2022 | $3,523 | $136,880 | $45,470 | $91,410 |
| 2021 | $3,704 | $136,880 | $45,470 | $91,410 |
| 2020 | $3,548 | $61,580 | $3,800 | $57,780 |
| 2019 | $559 | $14,660 | $3,800 | $10,860 |
| 2018 | $584 | $14,660 | $3,800 | $10,860 |
| 2017 | $872 | $14,660 | $3,800 | $10,860 |
| 2016 | $872 | $14,660 | $3,800 | $10,860 |
| 2015 | $794 | $12,850 | $4,000 | $8,850 |
| 2014 | $794 | $12,850 | $4,000 | $8,850 |
Source: Public Records
Map
Nearby Homes