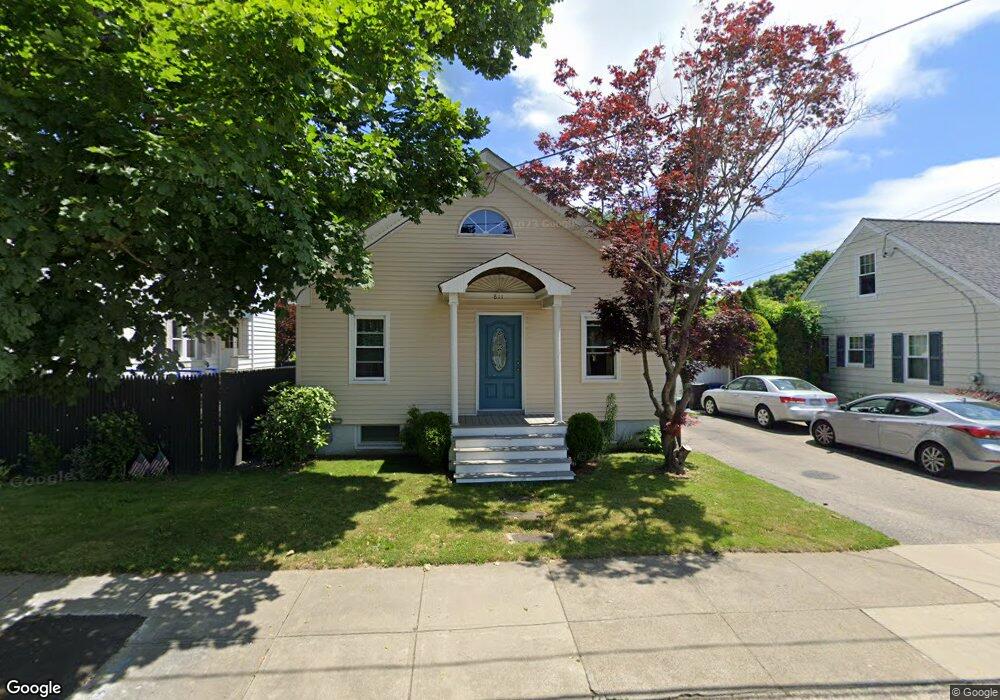
811 Oak Grove Ave Fall River, MA 02720
Bank Street NeighborhoodEstimated Value: $408,000 - $462,000
3
Beds
2
Baths
1,700
Sq Ft
$251/Sq Ft
Est. Value
About This Home
This home is located at 811 Oak Grove Ave, Fall River, MA 02720 and is currently estimated at $427,186, approximately $251 per square foot. 811 Oak Grove Ave is a home located in Bristol County with nearby schools including Spencer Borden Elementary School, Morton Middle School, and B M C Durfee High School.
Ownership History
Date
Name
Owned For
Owner Type
Purchase Details
Closed on
Oct 28, 1998
Sold by
Marques Manuel B
Bought by
Marques Mary C
Current Estimated Value
Home Financials for this Owner
Home Financials are based on the most recent Mortgage that was taken out on this home.
Original Mortgage
$48,000
Interest Rate
6.68%
Mortgage Type
Purchase Money Mortgage
Create a Home Valuation Report for This Property
The Home Valuation Report is an in-depth analysis detailing your home's value as well as a comparison with similar homes in the area
Home Values in the Area
Average Home Value in this Area
Purchase History
| Date | Buyer | Sale Price | Title Company |
|---|---|---|---|
| Marques Mary C | $25,000 | -- |
Source: Public Records
Mortgage History
| Date | Status | Borrower | Loan Amount |
|---|---|---|---|
| Open | Marques Mary C | $76,000 | |
| Closed | Marques Mary C | $75,000 | |
| Closed | Marques Mary C | $48,000 | |
| Previous Owner | Marques Mary C | $25,000 |
Source: Public Records
Tax History Compared to Growth
Tax History
| Year | Tax Paid | Tax Assessment Tax Assessment Total Assessment is a certain percentage of the fair market value that is determined by local assessors to be the total taxable value of land and additions on the property. | Land | Improvement |
|---|---|---|---|---|
| 2025 | $3,855 | $336,700 | $132,200 | $204,500 |
| 2024 | $3,640 | $316,800 | $127,100 | $189,700 |
| 2023 | $3,626 | $295,500 | $114,100 | $181,400 |
| 2022 | $3,245 | $257,100 | $105,700 | $151,400 |
| 2021 | $3,279 | $237,100 | $99,800 | $137,300 |
| 2020 | $3,091 | $213,900 | $96,100 | $117,800 |
| 2019 | $3,052 | $209,300 | $96,100 | $113,200 |
| 2018 | $2,950 | $201,800 | $96,100 | $105,700 |
| 2017 | $2,799 | $199,900 | $96,100 | $103,800 |
| 2016 | $2,651 | $194,500 | $96,100 | $98,400 |
| 2015 | $2,462 | $188,200 | $89,800 | $98,400 |
| 2014 | $2,368 | $188,200 | $89,800 | $98,400 |
Source: Public Records
Map
Nearby Homes
- 350 Doherty St
- 36 Fordney St
- 200 David St
- 108 Garden St
- 1268 President Ave
- 270 Garden St
- 380 Eddy St
- 49 Farnham St
- 302 Oak Grove Ave
- 168 Windsor St
- 342 Stetson St
- 243 Oak Grove Ave
- 1796 Locust St
- 235 Chavenson St
- 44 Fenmore St
- 884-886 Robeson St
- 37 Shawmut St
- 65 Bigelow St
- 545 Robeson St
- 344 Beattie St Unit 5
- 821 Oak Grove Ave
- 799 Oak Grove Ave
- 31 Hanson St
- 24 Bond St
- 0 Bond St
- 837 Oak Grove Ave
- 38 Bond St
- 90 Williamson St
- 91 Williamson St
- 48 Bond St
- 26 Hanson St
- 861 Oak Grove Ave
- 782 Oak Grove Ave
- 286 Newbury St
- 36 Hanson St
- 763 Oak Grove Ave
- 27 Bond St
- 27 Bond St Unit 3
- 27 Bond St Unit 2
- 74 Williamson St