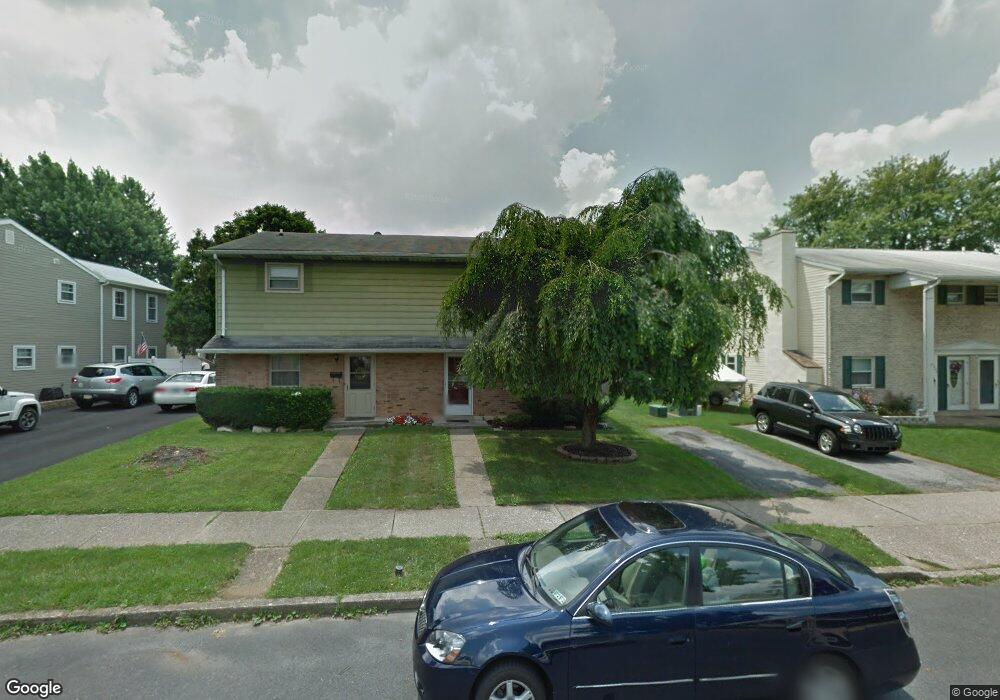
811 Poplar St Catasauqua, PA 18032
Estimated Value: $238,000 - $257,337
3
Beds
2
Baths
1,160
Sq Ft
$213/Sq Ft
Est. Value
About This Home
This home is located at 811 Poplar St, Catasauqua, PA 18032 and is currently estimated at $246,584, approximately $212 per square foot. 811 Poplar St is a home located in Lehigh County with nearby schools including Francis H Sheckler Elementary School, Catasauqua Middle School, and Catasauqua Senior High School.
Ownership History
Date
Name
Owned For
Owner Type
Purchase Details
Closed on
Jun 24, 2005
Sold by
811 Poplar Street Land Trust
Bought by
Inghrim Craig W
Current Estimated Value
Home Financials for this Owner
Home Financials are based on the most recent Mortgage that was taken out on this home.
Original Mortgage
$114,000
Outstanding Balance
$59,745
Interest Rate
5.82%
Mortgage Type
Fannie Mae Freddie Mac
Estimated Equity
$186,839
Purchase Details
Closed on
Dec 15, 1993
Sold by
Rummel Thomas G
Bought by
811 Poplar Street Land Trust
Purchase Details
Closed on
Dec 30, 1990
Bought by
Rummel Thomas G
Purchase Details
Closed on
Aug 25, 1983
Sold by
Jacobs Bruce A and Jacobs Linda H
Bought by
Rummel Frederick G and Rummel Martha L
Purchase Details
Closed on
Mar 7, 1975
Bought by
Jacobs Bruce A and Jacobs Linda H
Create a Home Valuation Report for This Property
The Home Valuation Report is an in-depth analysis detailing your home's value as well as a comparison with similar homes in the area
Home Values in the Area
Average Home Value in this Area
Purchase History
| Date | Buyer | Sale Price | Title Company |
|---|---|---|---|
| Inghrim Craig W | $120,000 | -- | |
| 811 Poplar Street Land Trust | -- | -- | |
| Rummel Thomas G | -- | -- | |
| Rummel Frederick G | $33,500 | -- | |
| Jacobs Bruce A | $26,500 | -- |
Source: Public Records
Mortgage History
| Date | Status | Borrower | Loan Amount |
|---|---|---|---|
| Open | Inghrim Craig W | $114,000 |
Source: Public Records
Tax History Compared to Growth
Tax History
| Year | Tax Paid | Tax Assessment Tax Assessment Total Assessment is a certain percentage of the fair market value that is determined by local assessors to be the total taxable value of land and additions on the property. | Land | Improvement |
|---|---|---|---|---|
| 2025 | $4,546 | $112,200 | $19,200 | $93,000 |
| 2024 | $4,441 | $112,200 | $19,200 | $93,000 |
| 2023 | $4,449 | $112,200 | $19,200 | $93,000 |
| 2022 | $3,479 | $112,200 | $93,000 | $19,200 |
| 2021 | $3,479 | $112,200 | $19,200 | $93,000 |
| 2020 | $3,354 | $112,200 | $19,200 | $93,000 |
| 2019 | $3,221 | $112,200 | $19,200 | $93,000 |
| 2018 | $3,045 | $112,200 | $19,200 | $93,000 |
| 2017 | $2,963 | $112,200 | $19,200 | $93,000 |
| 2016 | -- | $112,200 | $19,200 | $93,000 |
| 2015 | -- | $112,200 | $19,200 | $93,000 |
| 2014 | -- | $112,200 | $19,200 | $93,000 |
Source: Public Records
Map
Nearby Homes