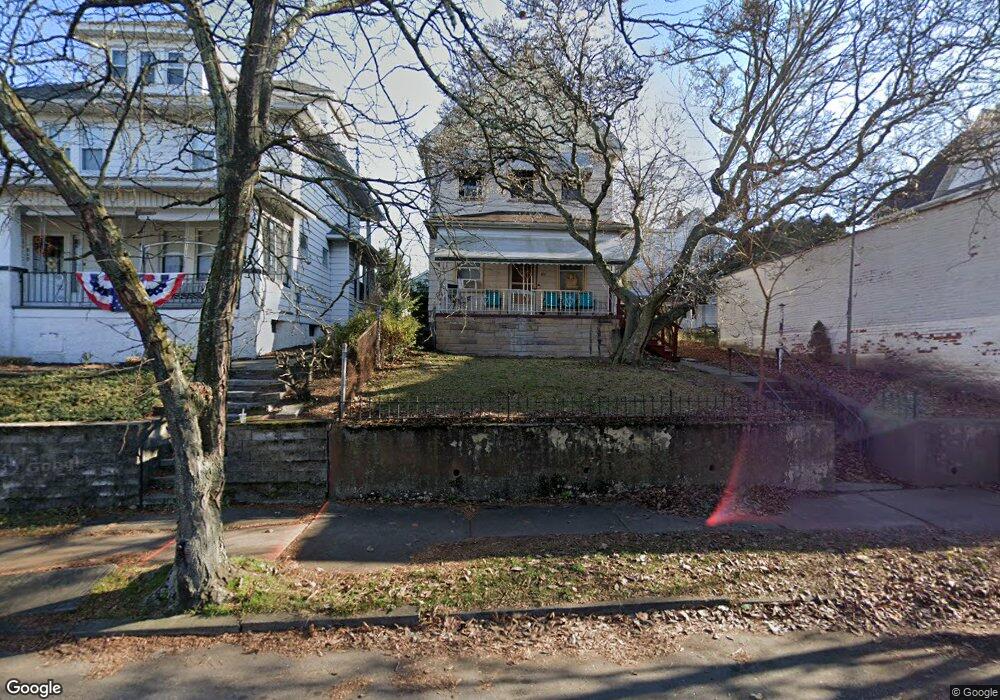
811 Prospect Ave Scranton, PA 18505
South Side NeighborhoodEstimated Value: $253,000 - $331,000
Studio
--
Bath
1,610
Sq Ft
$185/Sq Ft
Est. Value
About This Home
This home is located at 811 Prospect Ave, Scranton, PA 18505 and is currently estimated at $298,515, approximately $185 per square foot. 811 Prospect Ave is a home located in Lackawanna County with nearby schools including McNichols Plaza Elementary School, South Scranton Intermediate, and West Scranton High School.
Ownership History
Date
Name
Owned For
Owner Type
Purchase Details
Closed on
Jul 28, 2023
Sold by
Scp Efh Llc
Bought by
Vaquero Lizbeth
Current Estimated Value
Home Financials for this Owner
Home Financials are based on the most recent Mortgage that was taken out on this home.
Original Mortgage
$195,000
Outstanding Balance
$189,786
Interest Rate
6.81%
Mortgage Type
New Conventional
Estimated Equity
$108,730
Purchase Details
Closed on
Nov 12, 2020
Sold by
Blit Matthew J and Blit Matthew
Bought by
Scp Efh Llc
Purchase Details
Closed on
Aug 30, 2017
Sold by
Nape Kevin R
Bought by
Blit Erica and Husain Parveen
Purchase Details
Closed on
Apr 23, 2012
Sold by
Mrozek David H and Mrozek Mary Ellen
Bought by
Nape Kevin R
Create a Home Valuation Report for This Property
The Home Valuation Report is an in-depth analysis detailing your home's value as well as a comparison with similar homes in the area
Home Values in the Area
Average Home Value in this Area
Purchase History
| Date | Buyer | Sale Price | Title Company |
|---|---|---|---|
| Vaquero Lizbeth | $260,000 | None Listed On Document | |
| Scp Efh Llc | $1,050,000 | None Available | |
| Blit Matthew | -- | Landmark Abstract Agency Llc | |
| Blit Erica | $20,000 | None Available | |
| Nape Kevin R | $20,000 | None Available | |
| Nape Kevin R | -- | None Available |
Source: Public Records
Mortgage History
| Date | Status | Borrower | Loan Amount |
|---|---|---|---|
| Open | Vaquero Lizbeth | $195,000 |
Source: Public Records
Tax History
| Year | Tax Paid | Tax Assessment Tax Assessment Total Assessment is a certain percentage of the fair market value that is determined by local assessors to be the total taxable value of land and additions on the property. | Land | Improvement |
|---|---|---|---|---|
| 2025 | $3,947 | $12,000 | $2,350 | $9,650 |
| 2024 | $3,613 | $12,000 | $2,350 | $9,650 |
| 2023 | $3,613 | $12,000 | $2,350 | $9,650 |
| 2022 | $3,534 | $12,000 | $2,350 | $9,650 |
| 2021 | $3,534 | $12,000 | $2,350 | $9,650 |
| 2020 | $3,469 | $12,000 | $2,350 | $9,650 |
| 2019 | $3,265 | $12,000 | $2,350 | $9,650 |
| 2018 | $3,265 | $12,000 | $2,350 | $9,650 |
| 2017 | $3,209 | $12,000 | $2,350 | $9,650 |
| 2016 | $1,034 | $12,000 | $2,350 | $9,650 |
| 2015 | $2,423 | $12,000 | $2,350 | $9,650 |
| 2014 | -- | $12,000 | $2,350 | $9,650 |
Source: Public Records
Map
Nearby Homes
- 616 Birch St
- 719 S Webster Ave
- 828 Pittston Ave
- 635 E Elm St Unit Rear
- 1024 S Webster Ave
- 710 Pittston Ave
- 1019 S Webster Ave
- 1017 Hamm Ct
- 717 E Elm St Unit REAR
- 613 E Locust St
- 439 Alder St
- 518 Kirst Ct
- 1131 Pittston Ave
- 409 Prospect Ave
- 326 Neptune Place
- 522 524 River St
- 321 Prospect Ave
- 501-503 Cedar Ave
- 623 Crown Ave
- 417 S Irving Ave
- 809 Prospect Ave
- 817 Rear Prospect Ave
- 805 Prospect Ave
- 821 Prospect Ave
- 616 Birch St
- 827 Prospect Ave
- 620 Birch St Unit R
- 620 Birch St
- 816 Prospect Ave
- 613 Beech St
- 621 Beech St
- 628 Birch St
- 615 Beech St Unit 617
- 615 617 Beech
- 615 617 Beech Unit 1
- 615-617 Beech St
- 615 Beech St
- 814 Prospect Ave
- 802 Prospect Ave
Your Personal Tour Guide
Ask me questions while you tour the home.