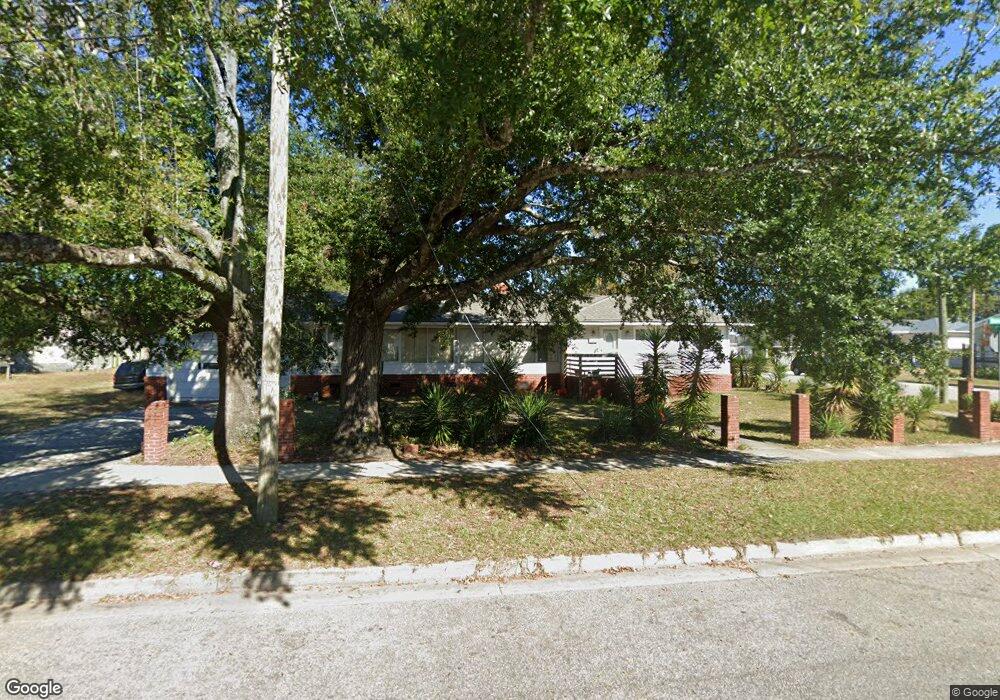
811 Queen St Wilmington, NC 28401
Dry Pond-South Side NeighborhoodEstimated Value: $339,000 - $463,000
3
Beds
2
Baths
1,637
Sq Ft
$252/Sq Ft
Est. Value
About This Home
This home is located at 811 Queen St, Wilmington, NC 28401 and is currently estimated at $411,952, approximately $251 per square foot. 811 Queen St is a home located in New Hanover County with nearby schools including Snipes Academy of Arts & Design, Williston Middle School, and John T. Hoggard High School.
Ownership History
Date
Name
Owned For
Owner Type
Purchase Details
Closed on
Dec 30, 2019
Sold by
Nixon Anna M
Bought by
Nixon Deborah Denise
Current Estimated Value
Purchase Details
Closed on
Jan 1, 2001
Bought by
Hawes Pattie
Purchase Details
Closed on
Jul 1, 1985
Sold by
Corbett Emily H John A
Bought by
Nixon E Edward
Purchase Details
Closed on
May 18, 1985
Sold by
King Katherine Hawes Charles M
Bought by
Corbett John A Emily H
Purchase Details
Closed on
Nov 1, 1944
Sold by
Hawes Pattie Hrs
Bought by
Hawes Emily O
Create a Home Valuation Report for This Property
The Home Valuation Report is an in-depth analysis detailing your home's value as well as a comparison with similar homes in the area
Home Values in the Area
Average Home Value in this Area
Purchase History
| Date | Buyer | Sale Price | Title Company |
|---|---|---|---|
| Nixon Deborah Denise | -- | None Available | |
| Hawes Pattie | -- | -- | |
| Nixon E Edward | -- | -- | |
| Corbett Emily H John A | -- | -- | |
| Corbett John A Emily H | -- | -- | |
| Hawes Emily O | $600 | -- |
Source: Public Records
Tax History Compared to Growth
Tax History
| Year | Tax Paid | Tax Assessment Tax Assessment Total Assessment is a certain percentage of the fair market value that is determined by local assessors to be the total taxable value of land and additions on the property. | Land | Improvement |
|---|---|---|---|---|
| 2025 | $1,147 | $389,700 | $78,200 | $311,500 |
| 2023 | $738 | $169,600 | $57,200 | $112,400 |
| 2022 | $721 | $169,600 | $57,200 | $112,400 |
| 2021 | $726 | $169,600 | $57,200 | $112,400 |
| 2020 | $1,386 | $131,600 | $13,700 | $117,900 |
| 2019 | $1,386 | $131,600 | $13,700 | $117,900 |
| 2018 | $1,386 | $131,600 | $13,700 | $117,900 |
| 2017 | $1,386 | $131,600 | $13,700 | $117,900 |
| 2016 | $978 | $88,300 | $43,200 | $45,100 |
| 2015 | $935 | $88,300 | $43,200 | $45,100 |
| 2014 | $895 | $88,300 | $43,200 | $45,100 |
Source: Public Records
Map
Nearby Homes