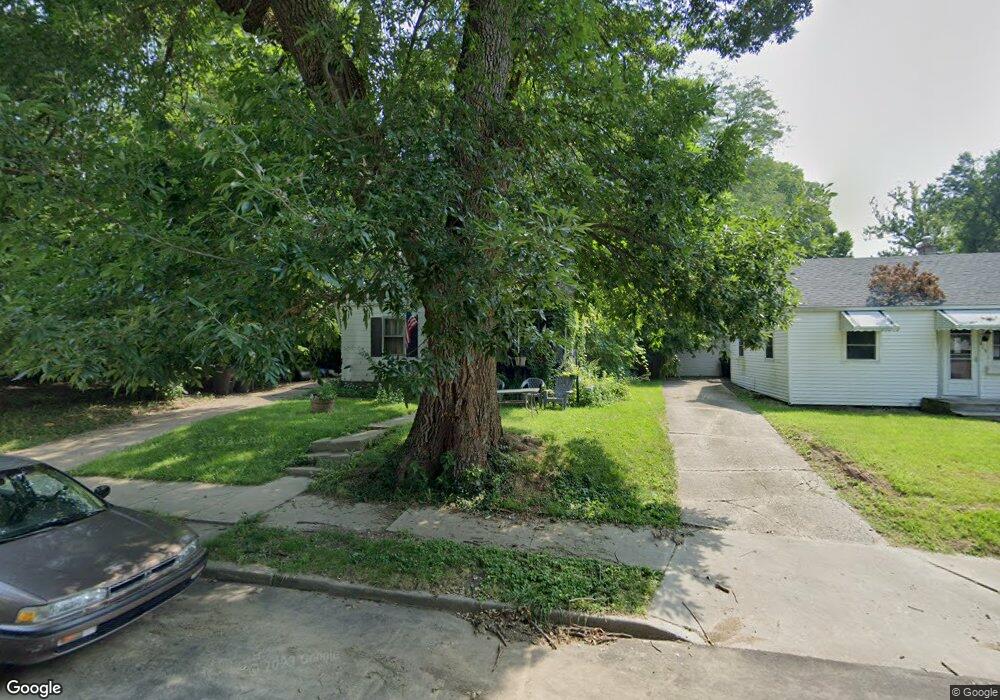
811 S 5th St Lafayette, IN 47905
Miller NeighborhoodEstimated Value: $139,000 - $182,000
--
Bed
--
Bath
922
Sq Ft
$172/Sq Ft
Est. Value
About This Home
This home is located at 811 S 5th St, Lafayette, IN 47905 and is currently estimated at $158,810, approximately $172 per square foot. 811 S 5th St is a home located in Tippecanoe County with nearby schools including Thomas Miller Elementary School, Lafayette Tecumseh Junior High School, and Sunnyside Intermediate School.
Ownership History
Date
Name
Owned For
Owner Type
Purchase Details
Closed on
May 11, 2007
Sold by
Beneficial Indiana Inc
Bought by
Etzel Jessie L
Current Estimated Value
Home Financials for this Owner
Home Financials are based on the most recent Mortgage that was taken out on this home.
Original Mortgage
$38,400
Outstanding Balance
$23,396
Interest Rate
6.2%
Mortgage Type
Purchase Money Mortgage
Estimated Equity
$135,414
Purchase Details
Closed on
Nov 7, 2006
Sold by
Timmons Pearlie
Bought by
Beneficial Indiana Inc and Beneficial Mortgage Co
Purchase Details
Closed on
May 19, 2003
Sold by
Beneficial Indiana Inc
Bought by
Timmons Pearlie
Home Financials for this Owner
Home Financials are based on the most recent Mortgage that was taken out on this home.
Original Mortgage
$55,100
Interest Rate
9.8%
Mortgage Type
Purchase Money Mortgage
Purchase Details
Closed on
Mar 4, 2003
Sold by
Berryman Gregory John and Berryman Susan A
Bought by
Beneficial Indiana Inc and Beneficial Mortgage Co
Create a Home Valuation Report for This Property
The Home Valuation Report is an in-depth analysis detailing your home's value as well as a comparison with similar homes in the area
Home Values in the Area
Average Home Value in this Area
Purchase History
| Date | Buyer | Sale Price | Title Company |
|---|---|---|---|
| Etzel Jessie L | -- | None Available | |
| Beneficial Indiana Inc | $56,989 | None Available | |
| Timmons Pearlie | -- | -- | |
| Beneficial Indiana Inc | $65,292 | -- |
Source: Public Records
Mortgage History
| Date | Status | Borrower | Loan Amount |
|---|---|---|---|
| Open | Etzel Jessie L | $38,400 | |
| Previous Owner | Timmons Pearlie | $55,100 | |
| Closed | Timmons Pearlie | $13,775 |
Source: Public Records
Tax History Compared to Growth
Tax History
| Year | Tax Paid | Tax Assessment Tax Assessment Total Assessment is a certain percentage of the fair market value that is determined by local assessors to be the total taxable value of land and additions on the property. | Land | Improvement |
|---|---|---|---|---|
| 2024 | $422 | $99,800 | $13,000 | $86,800 |
| 2023 | -- | $93,400 | $13,000 | $80,400 |
| 2022 | $0 | $76,100 | $13,000 | $63,100 |
| 2021 | $0 | $70,300 | $13,000 | $57,300 |
| 2020 | $0 | $64,600 | $13,000 | $51,600 |
| 2019 | $34 | $61,800 | $10,000 | $51,800 |
| 2018 | $34 | $59,600 | $10,000 | $49,600 |
| 2017 | $30 | $58,600 | $10,000 | $48,600 |
| 2016 | $25 | $57,400 | $10,000 | $47,400 |
| 2014 | -- | $61,200 | $10,000 | $51,200 |
| 2013 | -- | $60,600 | $10,000 | $50,600 |
Source: Public Records
Map
Nearby Homes