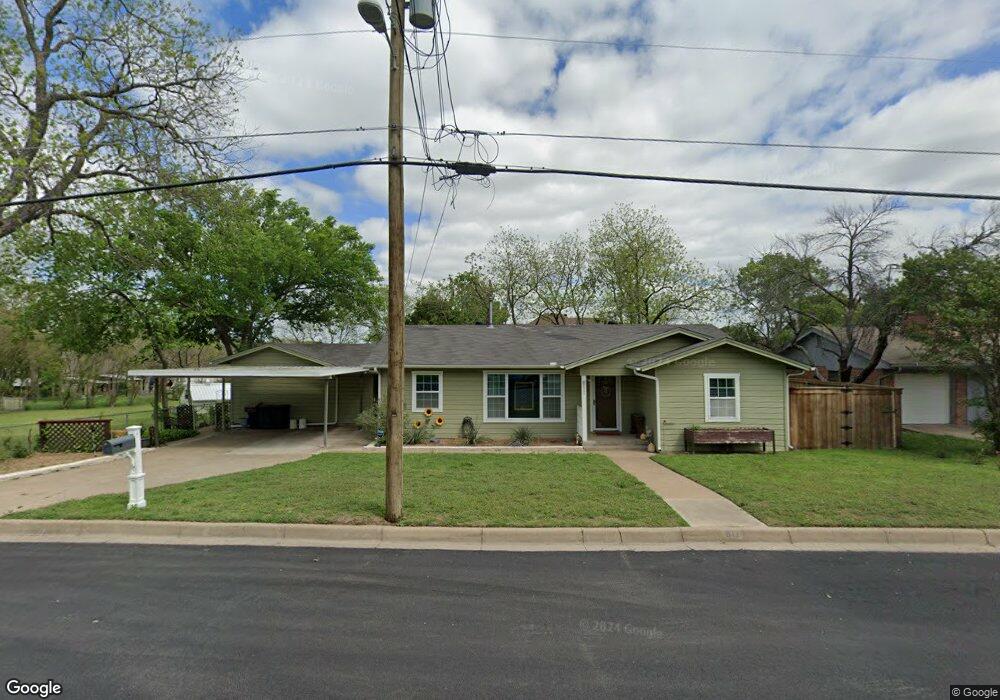
811 S Alamo St Weatherford, TX 76086
Estimated Value: $307,815 - $351,000
3
Beds
2
Baths
1,883
Sq Ft
$178/Sq Ft
Est. Value
About This Home
This home is located at 811 S Alamo St, Weatherford, TX 76086 and is currently estimated at $334,704, approximately $177 per square foot. 811 S Alamo St is a home located in Parker County with nearby schools including Curtis Elementary School, Hall Middle School, and Weatherford High School.
Ownership History
Date
Name
Owned For
Owner Type
Purchase Details
Closed on
Sep 10, 2020
Sold by
Porter Leonard C and Porter Kathleen M
Bought by
Cole Diana
Current Estimated Value
Purchase Details
Closed on
Nov 9, 2017
Sold by
Porter Joshua C
Bought by
Porter Leonard C and Porter Kathleen M
Purchase Details
Closed on
Sep 23, 2016
Sold by
Abdur Razzaaq Samad and Abdur Razzaaq Elaine
Bought by
Porter Joshua Craig
Home Financials for this Owner
Home Financials are based on the most recent Mortgage that was taken out on this home.
Original Mortgage
$150,000
Interest Rate
3.45%
Mortgage Type
Purchase Money Mortgage
Purchase Details
Closed on
Apr 29, 2002
Sold by
King Steve M
Bought by
Porter Joshua Craig
Purchase Details
Closed on
Apr 26, 2002
Sold by
King Steve M
Bought by
Porter Joshua Craig
Create a Home Valuation Report for This Property
The Home Valuation Report is an in-depth analysis detailing your home's value as well as a comparison with similar homes in the area
Home Values in the Area
Average Home Value in this Area
Purchase History
| Date | Buyer | Sale Price | Title Company |
|---|---|---|---|
| Cole Diana | -- | Providence Title Company | |
| Porter Leonard C | -- | None Available | |
| Porter Joshua Craig | -- | Providence Title | |
| Porter Joshua Craig | -- | -- | |
| Porter Joshua Craig | -- | -- |
Source: Public Records
Mortgage History
| Date | Status | Borrower | Loan Amount |
|---|---|---|---|
| Previous Owner | Porter Joshua Craig | $150,000 |
Source: Public Records
Tax History Compared to Growth
Tax History
| Year | Tax Paid | Tax Assessment Tax Assessment Total Assessment is a certain percentage of the fair market value that is determined by local assessors to be the total taxable value of land and additions on the property. | Land | Improvement |
|---|---|---|---|---|
| 2025 | $3,397 | $307,134 | -- | -- |
| 2024 | $3,397 | $279,213 | -- | -- |
| 2023 | $3,397 | $253,830 | $0 | $0 |
| 2022 | $5,119 | $230,760 | $20,000 | $210,760 |
| 2021 | $5,542 | $230,760 | $20,000 | $210,760 |
| 2020 | $4,418 | $182,860 | $20,000 | $162,860 |
| 2019 | $4,670 | $182,860 | $20,000 | $162,860 |
| 2018 | $3,992 | $155,620 | $20,000 | $135,620 |
| 2017 | $4,095 | $155,620 | $20,000 | $135,620 |
| 2016 | $2,514 | $95,550 | $20,000 | $75,550 |
| 2015 | $2,093 | $95,550 | $20,000 | $75,550 |
| 2014 | $2,031 | $89,210 | $20,000 | $69,210 |
Source: Public Records
Map
Nearby Homes
- 824 S Alamo St
- 708 S Waco St
- 902 S Waco St
- 112 W Akard St
- 904 S Brazos St
- 905 S Lamar St
- 1009 S Brazos St
- 115 E Akard St
- 609 S Elm St
- 514 W Josephine St
- 504 W Lee Ave
- 407 W Columbia St
- 213 Jefferson St
- 221 Jefferson St
- 208 Jefferson St
- 237 Jefferson St
- 220 Jefferson St
- 1213 S Lamar St
- 318 S Walnut St
- 514 W Baylor St
- 810 S Alamo St
- 819 S Alamo St
- 815 S Alamo St
- 814 S Waco St
- 814 S Alamo St
- 818 S Alamo St
- 209 W Akard St
- 821 S Alamo St
- 820 S Waco St
- 822 S Waco St
- 804 S Alamo St
- 802 S Waco St
- 210 Cleveland Ave
- 815 S Waco St
- 828 S Alamo St
- 805 S Waco St
- 824 S Waco St
- 817 S Waco St
- 717 Oyster Hill St
- 306 Cleveland Ave