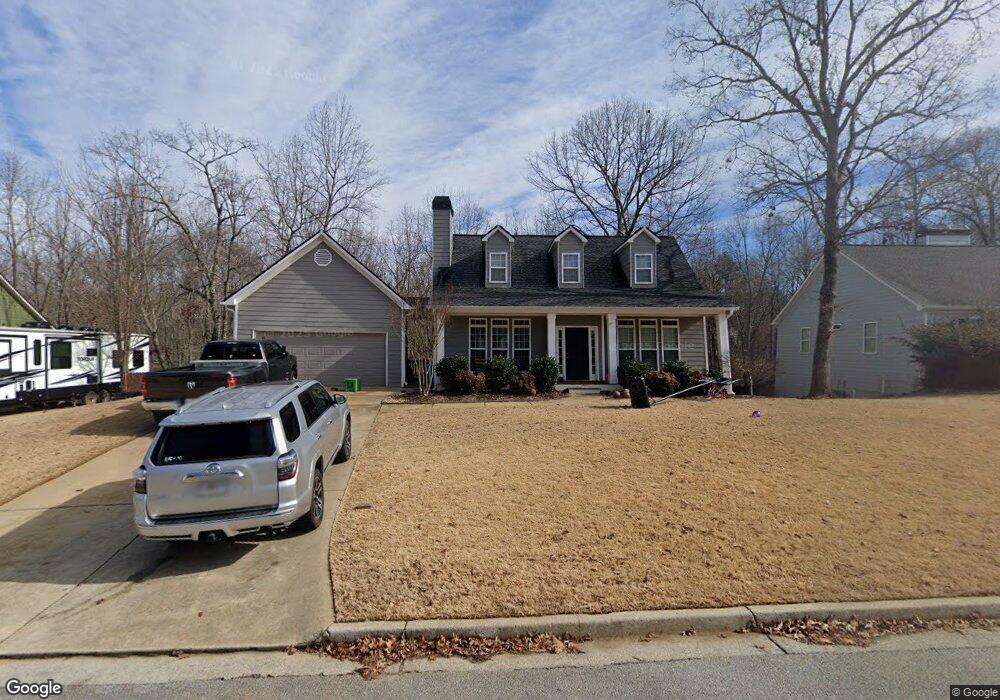
811 Safe Harbor Dr Dallas, GA 30157
Estimated Value: $319,143 - $355,000
3
Beds
2
Baths
1,638
Sq Ft
$207/Sq Ft
Est. Value
About This Home
This home is located at 811 Safe Harbor Dr, Dallas, GA 30157 and is currently estimated at $339,786, approximately $207 per square foot. 811 Safe Harbor Dr is a home located in Paulding County with nearby schools including Union Elementary School, Carl Scoggins Sr. Middle School, and South Paulding High School.
Ownership History
Date
Name
Owned For
Owner Type
Purchase Details
Closed on
Mar 27, 2018
Sold by
Ph Funding Llc
Bought by
George Tomas Homes Llc
Current Estimated Value
Purchase Details
Closed on
Mar 5, 2010
Sold by
Hud & Housing Of Urban Dev
Bought by
Watkins Adam N
Home Financials for this Owner
Home Financials are based on the most recent Mortgage that was taken out on this home.
Original Mortgage
$132,173
Interest Rate
5.5%
Mortgage Type
FHA
Purchase Details
Closed on
Dec 2, 2008
Sold by
Everhome Mtg
Bought by
Hud-Housing Of Urban Dev
Purchase Details
Closed on
Apr 28, 2006
Sold by
Hills At Safe Harbor Llc
Bought by
Harris-Crenshaw Sylvia
Home Financials for this Owner
Home Financials are based on the most recent Mortgage that was taken out on this home.
Original Mortgage
$182,526
Interest Rate
6.33%
Mortgage Type
FHA
Create a Home Valuation Report for This Property
The Home Valuation Report is an in-depth analysis detailing your home's value as well as a comparison with similar homes in the area
Home Values in the Area
Average Home Value in this Area
Purchase History
| Date | Buyer | Sale Price | Title Company |
|---|---|---|---|
| George Tomas Homes Llc | $205,230 | -- | |
| Watkins Adam N | $130,000 | -- | |
| Hud-Housing Of Urban Dev | -- | -- | |
| Everhome Mtg Co | $201,066 | -- | |
| Harris-Crenshaw Sylvia | $184,000 | -- |
Source: Public Records
Mortgage History
| Date | Status | Borrower | Loan Amount |
|---|---|---|---|
| Previous Owner | Watkins Adam N | $132,173 | |
| Previous Owner | Harris-Crenshaw Sylvia | $182,526 |
Source: Public Records
Tax History Compared to Growth
Tax History
| Year | Tax Paid | Tax Assessment Tax Assessment Total Assessment is a certain percentage of the fair market value that is determined by local assessors to be the total taxable value of land and additions on the property. | Land | Improvement |
|---|---|---|---|---|
| 2024 | $3,116 | $125,264 | $12,000 | $113,264 |
| 2023 | $3,392 | $130,116 | $12,000 | $118,116 |
| 2022 | $2,368 | $90,824 | $12,000 | $78,824 |
| 2021 | $2,497 | $85,940 | $10,000 | $75,940 |
| 2020 | $2,297 | $77,344 | $10,000 | $67,344 |
| 2019 | $2,076 | $68,888 | $10,000 | $58,888 |
| 2018 | $1,737 | $57,660 | $9,600 | $48,060 |
| 2017 | $1,675 | $54,840 | $9,600 | $45,240 |
| 2016 | $1,584 | $52,400 | $9,600 | $42,800 |
| 2015 | $1,482 | $48,160 | $9,600 | $38,560 |
| 2014 | $1,402 | $44,400 | $9,600 | $34,800 |
| 2013 | -- | $43,000 | $9,600 | $33,400 |
Source: Public Records
Map
Nearby Homes
- 0 Billy Bullock Rd Unit 10622076
- 363 Safe Harbor Dr
- 0 Buchanan Hwy Unit 10367629
- 00 Billy Bullock Rd
- 270 Harmony Woods Dr
- 281 Harmony Woods Dr
- 00002 Boulder View Pkwy
- 728 Harmony Rd
- 334 Stonehenge Dr
- 15 Quarry Ln
- 0 Old White Oak Cemetery Rd Unit 7657345
- 0 Old White Oak Cemetery Rd Unit 10596969
- 59 Mullberry Path
- 703 Mulberry Rock Rd
- 232 Cynthia Ct
- 65 Cynthia Ct
- 14 Clint Ct
- 12 Shingle Oak Ct
- 177 Rustin Dr
- 797 Safe Harbor Dr
- 816 Safe Harbor Dr
- 833 Safe Harbor Dr
- 792 Safe Harbor Dr
- 781 Safe Harbor Dr
- 838 Safe Harbor Dr
- 851 Safe Harbor Dr
- 759 Safe Harbor Dr
- 876 Safe Harbor Dr
- 760 Safe Harbor Dr
- 871 Safe Harbor Dr
- 91 Safe Passage Ct
- 737 Safe Harbor Dr
- 716 Safe Harbor Dr
- 914 Safe Harbor Dr
- 881 Safe Harbor Dr
- 7310 Buchanan Hwy
- 909 Safe Harbor Dr
- 94 Safe Passage Ct
- 75 Safe Passage Ct