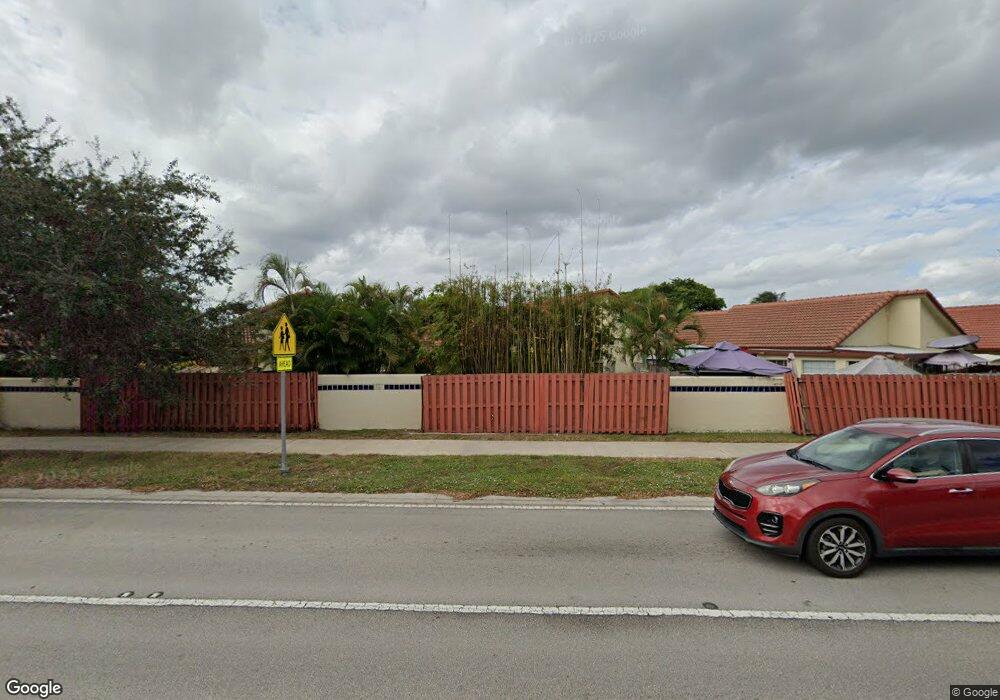
811 SW 113th Ave Pembroke Pines, FL 33025
Pembroke Lakes South NeighborhoodEstimated Value: $435,000 - $539,000
2
Beds
2
Baths
1,416
Sq Ft
$360/Sq Ft
Est. Value
About This Home
This home is located at 811 SW 113th Ave, Pembroke Pines, FL 33025 and is currently estimated at $510,061, approximately $360 per square foot. 811 SW 113th Ave is a home located in Broward County with nearby schools including Palm Cove Elementary School, Pines Middle School, and Charles W Flanagan High School.
Ownership History
Date
Name
Owned For
Owner Type
Purchase Details
Closed on
Dec 18, 2009
Sold by
Mayer Gerard E and Mayer Terilyn C
Bought by
Mayer Gerard E and Mayer Terilyn C
Current Estimated Value
Purchase Details
Closed on
Sep 26, 2002
Sold by
Mayer Terilyn C and Mayer Gerard E
Bought by
Mayer Gerard E and Mayer Terilyn C
Purchase Details
Closed on
May 26, 2000
Sold by
Londono Claudia J and Pacheco Jacquelin Miriam
Bought by
Mayer Terilyn C
Purchase Details
Closed on
May 22, 2000
Sold by
Available Not
Bought by
Available Not
Purchase Details
Closed on
Jan 16, 1998
Sold by
Hickey Edward M and Hickey Kirsten
Bought by
Londono Claudia J and Pacheco Jacquelin M
Home Financials for this Owner
Home Financials are based on the most recent Mortgage that was taken out on this home.
Original Mortgage
$113,395
Interest Rate
7.16%
Mortgage Type
FHA
Purchase Details
Closed on
Oct 22, 1993
Sold by
Potter Lori Leigh
Bought by
Hickey Edward M
Home Financials for this Owner
Home Financials are based on the most recent Mortgage that was taken out on this home.
Original Mortgage
$105,162
Interest Rate
6.9%
Mortgage Type
VA
Create a Home Valuation Report for This Property
The Home Valuation Report is an in-depth analysis detailing your home's value as well as a comparison with similar homes in the area
Home Values in the Area
Average Home Value in this Area
Purchase History
| Date | Buyer | Sale Price | Title Company |
|---|---|---|---|
| Mayer Gerard E | -- | Attorney | |
| Mayer Gerard E | -- | Superior Title & Guaranty | |
| Mayer Terilyn C | $118,000 | -- | |
| Available Not | $118,000 | -- | |
| Londono Claudia J | $114,800 | -- | |
| Hickey Edward M | $108,000 | -- |
Source: Public Records
Mortgage History
| Date | Status | Borrower | Loan Amount |
|---|---|---|---|
| Previous Owner | Londono Claudia J | $113,395 | |
| Previous Owner | Hickey Edward M | $105,162 |
Source: Public Records
Tax History Compared to Growth
Tax History
| Year | Tax Paid | Tax Assessment Tax Assessment Total Assessment is a certain percentage of the fair market value that is determined by local assessors to be the total taxable value of land and additions on the property. | Land | Improvement |
|---|---|---|---|---|
| 2025 | -- | $172,080 | -- | -- |
| 2024 | $2,625 | $167,240 | -- | -- |
| 2023 | $2,625 | $162,370 | $0 | $0 |
| 2022 | $2,541 | $157,650 | $0 | $0 |
| 2021 | $2,467 | $153,060 | $0 | $0 |
| 2020 | $2,446 | $150,950 | $0 | $0 |
| 2019 | $2,384 | $147,560 | $0 | $0 |
| 2018 | $2,264 | $143,730 | $0 | $0 |
| 2017 | $2,230 | $140,780 | $0 | $0 |
| 2016 | -- | $137,890 | $0 | $0 |
| 2015 | -- | $136,940 | $0 | $0 |
| 2014 | -- | $135,860 | $0 | $0 |
| 2013 | $22 | $179,550 | $36,390 | $143,160 |
Source: Public Records
Map
Nearby Homes
- 810 SW 113th Terrace
- 640 SW 113th Terrace
- 11133 SW 8th St Unit 1029
- 620 SW 111th Ave Unit 104
- 711 SW 111th Way Unit 3017
- 720 SW 111th Ave Unit 307
- 677 SW 111th Ave Unit 303
- 11185 SW 6th St Unit 3032
- 520 SW 111th Ave Unit 202
- 655 SW 111th Way Unit 3086
- 777 SW 111th Way Unit 1018
- 11282 SW 9th Ct
- 949 SW 113th Terrace
- 1013 SW 112th Terrace Unit 1013
- 10921 SW 10th Ct
- 1042 SW 113th Terrace Unit 121
- 445 SW 113th Ln
- 11248 SW 11th St
- 461 SW 113th Way Unit 461
- 530 SW 113th Way
- 801 SW 113th Ave
- 821 SW 113th Ave
- 741 SW 113th Ave
- 831 SW 113th Ave
- 731 SW 113th Ave
- 11321 SW 8th Place
- 11300 SW 8th Place
- 740 SW 113th Ave
- 11310 SW 8th Place
- 730 SW 113th Ave
- 721 SW 113th Ave
- 11331 SW 8th Place
- 11320 SW 8th Place
- 720 SW 113th Ave
- 711 SW 113th Ave
- 11330 SW 8th Place
- 11341 SW 8th Place
- 710 SW 113th Ave
- 741 SW 113th Terrace
- 11340 SW 8th Place