Estimated Value: $281,000 - $312,000
4
Beds
3
Baths
2,805
Sq Ft
$105/Sq Ft
Est. Value
About This Home
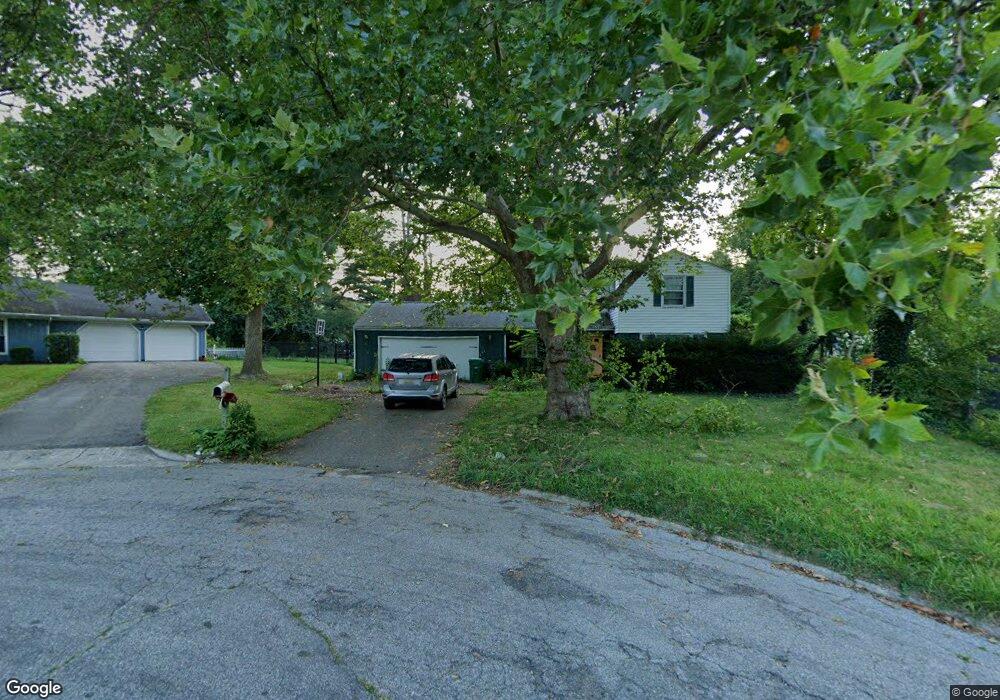
This home is located at 811 Totomee Ln, Niles, MI 49120 and is currently estimated at $295,536, approximately $105 per square foot. 811 Totomee Ln is a home located in Berrien County with nearby schools including Ballard Elementary School, Oak Manor Sixth Grade Center, and Ring Lardner Middle School.
Ownership History
Date
Name
Owned For
Owner Type
Purchase Details
Closed on
Oct 20, 2017
Sold by
Fisher Dale H
Bought by
Goodrich Fisher Nichole M
Current Estimated Value
Home Financials for this Owner
Home Financials are based on the most recent Mortgage that was taken out on this home.
Original Mortgage
$109,300
Outstanding Balance
$91,589
Interest Rate
3.94%
Mortgage Type
New Conventional
Estimated Equity
$203,947
Purchase Details
Closed on
Aug 13, 2007
Sold by
Cartus Financial Corp
Bought by
Fisher Dale H
Home Financials for this Owner
Home Financials are based on the most recent Mortgage that was taken out on this home.
Original Mortgage
$125,000
Interest Rate
6.71%
Mortgage Type
Unknown
Purchase Details
Closed on
Oct 23, 2006
Sold by
Meyers Kathy L and Tuzinowski Kathy L
Bought by
Cartus Financial Corp
Purchase Details
Closed on
Dec 7, 2000
Purchase Details
Closed on
Aug 1, 1980
Purchase Details
Closed on
Jun 29, 1979
Purchase Details
Closed on
Jun 25, 1977
Create a Home Valuation Report for This Property
The Home Valuation Report is an in-depth analysis detailing your home's value as well as a comparison with similar homes in the area
Home Values in the Area
Average Home Value in this Area
Purchase History
| Date | Buyer | Sale Price | Title Company |
|---|---|---|---|
| Goodrich Fisher Nichole M | -- | None Available | |
| Fisher Dale H | $125,000 | Cti | |
| Cartus Financial Corp | $136,750 | Fidelity National Title | |
| -- | $125,000 | -- | |
| -- | $58,000 | -- | |
| -- | $53,500 | -- | |
| -- | $49,000 | -- |
Source: Public Records
Mortgage History
| Date | Status | Borrower | Loan Amount |
|---|---|---|---|
| Open | Goodrich Fisher Nichole M | $109,300 | |
| Closed | Fisher Dale H | $125,000 |
Source: Public Records
Tax History Compared to Growth
Tax History
| Year | Tax Paid | Tax Assessment Tax Assessment Total Assessment is a certain percentage of the fair market value that is determined by local assessors to be the total taxable value of land and additions on the property. | Land | Improvement |
|---|---|---|---|---|
| 2025 | $2,899 | $132,800 | $0 | $0 |
| 2024 | $2,297 | $123,200 | $0 | $0 |
| 2023 | $2,202 | $115,000 | $0 | $0 |
| 2022 | $2,097 | $109,700 | $0 | $0 |
| 2021 | $2,567 | $106,100 | $7,700 | $98,400 |
| 2020 | $2,540 | $99,800 | $0 | $0 |
| 2019 | $2,502 | $74,000 | $3,500 | $70,500 |
| 2018 | $2,419 | $74,000 | $0 | $0 |
| 2017 | $2,380 | $62,700 | $0 | $0 |
| 2016 | $2,332 | $62,200 | $0 | $0 |
| 2015 | $2,362 | $66,000 | $0 | $0 |
| 2014 | $1,857 | $68,900 | $0 | $0 |
Source: Public Records
Map
Nearby Homes
- V/L Wesaw Rd
- 1010 Tomahawk Ln
- 1604 Orchard Ln
- 314 S Saint Joseph Ave
- 413 S Street Joseph Ave
- 1402 Niles Buchanan Rd
- 124 S State St
- 1619 Orchard Ln
- 115 S State St
- 537 Grant St
- 0 Bond St
- 43 N Lincoln Ave
- 23 Market St
- 1551 Cedar Point Dr
- 1695 Signal Point Dr
- 121 Michigan St
- 0 Cedar Point Dr
- 47 S 3rd St
- 300 Carefree Ct
- Integrity 1605 Plan at Carefree Villas
- 809 Totomee Ln
- 814 Totomee Ln
- 820 Sassafras Ln
- 818 Sassafras Ln
- 816 Totomee Ln
- 800 Sassafras Ln
- 805 Tomahawk Ln
- 820 Totomee Ln
- 724 Sassafras Ln
- 828 Sassafras Ln
- 801 Sassafras Ln
- 811 Sassafras Ln
- 727 Sassafras Ln
- 806 Tomahawk Ln
- 813 W Chicago Rd
- 901 Sassafras Ln
- 807 W Chicago Rd
- 808 Tomahawk Ln
- 800 Tomahawk Ln
- 801 W Chicago Rd