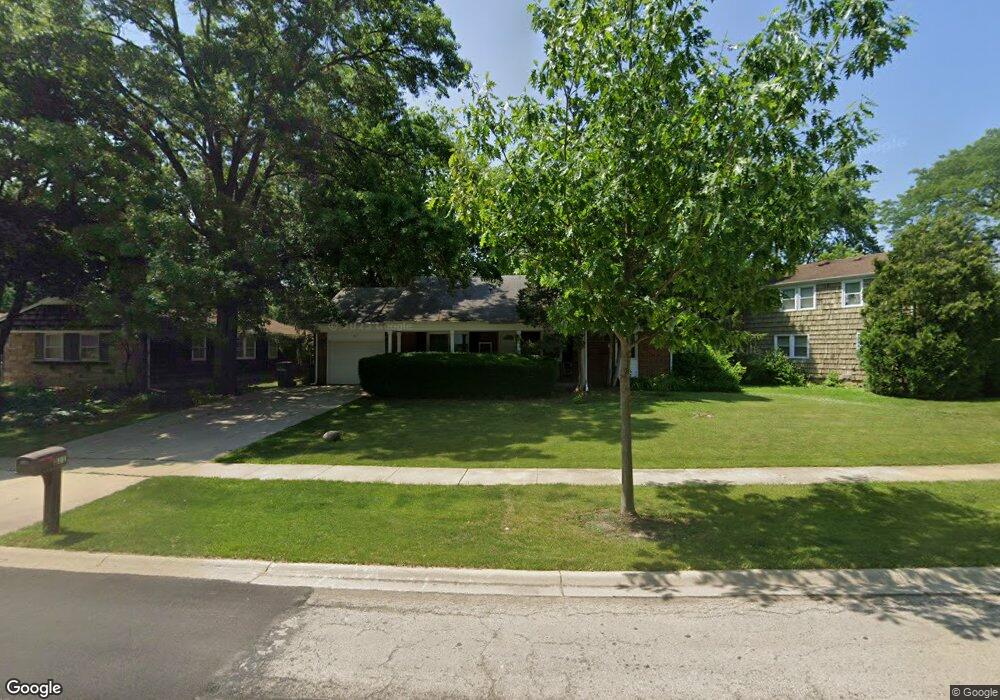
811 Twisted Oak Ln Unit 6 Buffalo Grove, IL 60089
Estimated Value: $385,460 - $444,000
--
Bed
2
Baths
1,176
Sq Ft
$355/Sq Ft
Est. Value
About This Home
This home is located at 811 Twisted Oak Ln Unit 6, Buffalo Grove, IL 60089 and is currently estimated at $417,865, approximately $355 per square foot. 811 Twisted Oak Ln Unit 6 is a home located in Lake County with nearby schools including Ivy Hall Elementary School, Twin Groves Middle School, and Adlai E Stevenson High School.
Ownership History
Date
Name
Owned For
Owner Type
Purchase Details
Closed on
May 12, 2021
Sold by
Fish Simon and Fish Olga
Bought by
Fish Simon and Fish Olga
Current Estimated Value
Purchase Details
Closed on
Sep 25, 2019
Sold by
Fish Seymon and Fish Olga
Bought by
Fish Simon and Fish Olga
Home Financials for this Owner
Home Financials are based on the most recent Mortgage that was taken out on this home.
Original Mortgage
$190,500
Outstanding Balance
$146,896
Interest Rate
3.4%
Mortgage Type
New Conventional
Estimated Equity
$270,969
Purchase Details
Closed on
Sep 26, 1997
Sold by
Corin Kenneth B and Corin Wendy E
Bought by
Fish Semyon and Fish Olga
Home Financials for this Owner
Home Financials are based on the most recent Mortgage that was taken out on this home.
Original Mortgage
$154,800
Interest Rate
7.25%
Create a Home Valuation Report for This Property
The Home Valuation Report is an in-depth analysis detailing your home's value as well as a comparison with similar homes in the area
Home Values in the Area
Average Home Value in this Area
Purchase History
| Date | Buyer | Sale Price | Title Company |
|---|---|---|---|
| Fish Simon | -- | Attorney | |
| Fish Simon | -- | Citywide Title Corporation | |
| Fish Semyon | $113,333 | -- |
Source: Public Records
Mortgage History
| Date | Status | Borrower | Loan Amount |
|---|---|---|---|
| Open | Fish Simon | $190,500 | |
| Closed | Fish Semyon | $154,800 |
Source: Public Records
Tax History Compared to Growth
Tax History
| Year | Tax Paid | Tax Assessment Tax Assessment Total Assessment is a certain percentage of the fair market value that is determined by local assessors to be the total taxable value of land and additions on the property. | Land | Improvement |
|---|---|---|---|---|
| 2024 | $10,136 | $104,719 | $37,911 | $66,808 |
| 2023 | $9,083 | $98,810 | $35,772 | $63,038 |
| 2022 | $9,083 | $87,103 | $31,534 | $55,569 |
| 2021 | $7,627 | $86,164 | $31,194 | $54,970 |
| 2020 | $7,450 | $86,458 | $31,300 | $55,158 |
| 2019 | $7,354 | $86,140 | $31,185 | $54,955 |
| 2018 | $7,215 | $87,250 | $30,819 | $56,431 |
| 2017 | $7,070 | $85,214 | $30,100 | $55,114 |
| 2016 | $6,742 | $81,599 | $28,823 | $52,776 |
| 2015 | $6,515 | $76,311 | $26,955 | $49,356 |
| 2014 | $5,837 | $63,812 | $28,950 | $34,862 |
| 2012 | $6,640 | $72,236 | $29,008 | $43,228 |
Source: Public Records
Map
Nearby Homes
- 390 Springside Ln
- 610 Checker Dr
- 800 Clohesey Dr
- 711 Woodhollow Ln
- 746 Old Checker Rd Unit E5
- 412 Chateau Dr
- 1112 Auburn Ln
- 931 Shady Grove Ln
- 950 Belmar Ln
- 1141 Devonshire Rd
- 12 Cloverdale Ct
- 603 Cherbourg Ct N
- 887 Saybrook Ln Unit 2
- 98 Stonegate Rd
- 938 Hidden Lake Dr
- 625 Marseilles Cir
- 1113 Lockwood Dr
- 670 Dunhill Dr
- 720 Dunhill Dr
- 1265 Devonshire Rd
- 821 Twisted Oak Ln
- 801 Twisted Oak Ln
- 830 Dorncliff Ln
- 820 Dorncliff Ln
- 831 Twisted Oak Ln
- 840 Dorncliff Ln
- 820 Twisted Oak Ln
- 810 Twisted Oak Ln
- 800 Twisted Oak Ln
- 830 Twisted Oak Ln
- 790 Twisted Oak Ln
- 850 Dorncliff Ln
- 841 Twisted Oak Ln
- 780 Twisted Oak Ln
- 840 Twisted Oak Ln Unit 6
- 511 Checker Dr
- 501 Checker Dr
- 860 Dorncliff Ln
- 770 Twisted Oak Ln
- 521 Checker Dr