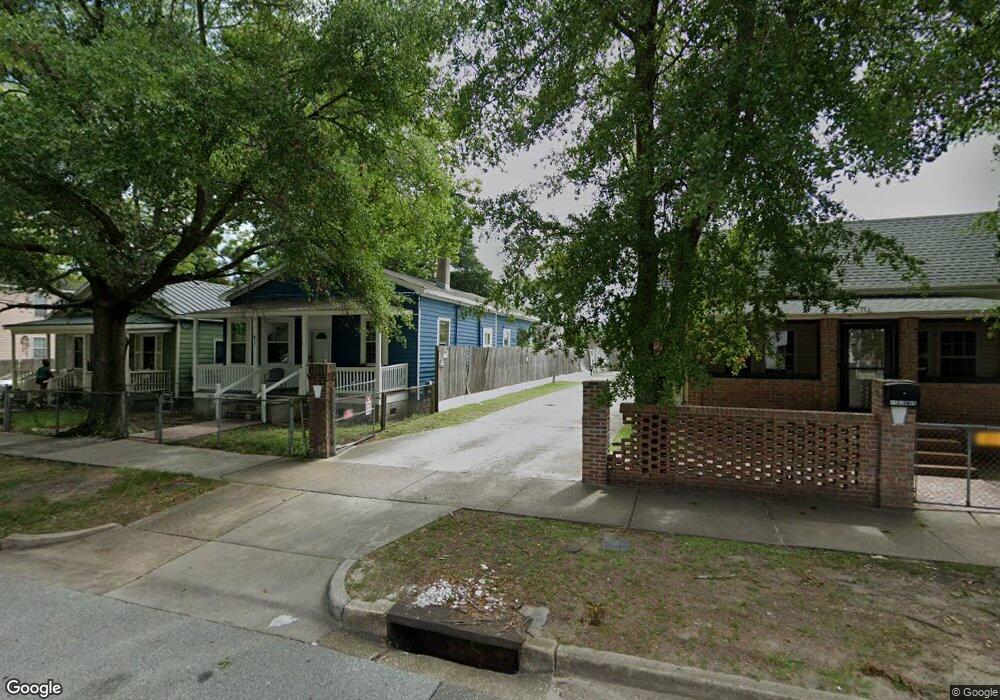
811 van Ambridge Aly Wilmington, NC 28401
Dry Pond-South Side NeighborhoodEstimated Value: $185,000 - $233,000
2
Beds
1
Bath
672
Sq Ft
$297/Sq Ft
Est. Value
About This Home
This home is located at 811 van Ambridge Aly, Wilmington, NC 28401 and is currently estimated at $199,765, approximately $297 per square foot. 811 van Ambridge Aly is a home located in New Hanover County with nearby schools including Snipes Academy of Arts & Design, Williston Middle School, and John T. Hoggard High School.
Ownership History
Date
Name
Owned For
Owner Type
Purchase Details
Closed on
Nov 23, 2004
Sold by
Jones Timothy L Felica J
Bought by
Vereen Jacqueline
Current Estimated Value
Purchase Details
Closed on
Feb 21, 1992
Sold by
Barnett Joe L Dorothy L
Bought by
Verreen Jacqueline E
Purchase Details
Closed on
Jun 1, 1986
Sold by
Crawford Geneva
Bought by
Barnett Joe L Dorothy L
Purchase Details
Closed on
Oct 1, 1981
Sold by
Crawford Bobby C
Bought by
Crawford Geneva
Purchase Details
Closed on
Dec 1, 1980
Sold by
Turner Billy D
Bought by
Crawford Bobby C
Purchase Details
Closed on
Jun 1, 1977
Bought by
Turner Billy D
Create a Home Valuation Report for This Property
The Home Valuation Report is an in-depth analysis detailing your home's value as well as a comparison with similar homes in the area
Home Values in the Area
Average Home Value in this Area
Purchase History
| Date | Buyer | Sale Price | Title Company |
|---|---|---|---|
| Vereen Jacqueline | -- | -- | |
| Jones Timothy Felicia | -- | -- | |
| Verreen Jacqueline E | $22,000 | -- | |
| Barnett Joe L Dorothy L | $5,500 | -- | |
| Crawford Geneva | -- | -- | |
| Crawford Bobby C | -- | -- | |
| Turner Billy D | $3,500 | -- |
Source: Public Records
Tax History Compared to Growth
Tax History
| Year | Tax Paid | Tax Assessment Tax Assessment Total Assessment is a certain percentage of the fair market value that is determined by local assessors to be the total taxable value of land and additions on the property. | Land | Improvement |
|---|---|---|---|---|
| 2025 | $884 | $150,200 | $28,400 | $121,800 |
| 2023 | $761 | $87,500 | $33,800 | $53,700 |
| 2022 | $744 | $87,500 | $33,800 | $53,700 |
| 2021 | $749 | $87,500 | $33,800 | $53,700 |
| 2020 | $418 | $39,700 | $9,600 | $30,100 |
| 2019 | $418 | $39,700 | $9,600 | $30,100 |
| 2018 | $418 | $39,700 | $9,600 | $30,100 |
| 2017 | $418 | $39,700 | $9,600 | $30,100 |
| 2016 | $361 | $32,600 | $14,300 | $18,300 |
| 2015 | $345 | $32,600 | $14,300 | $18,300 |
| 2014 | $331 | $32,600 | $14,300 | $18,300 |
Source: Public Records
Map
Nearby Homes