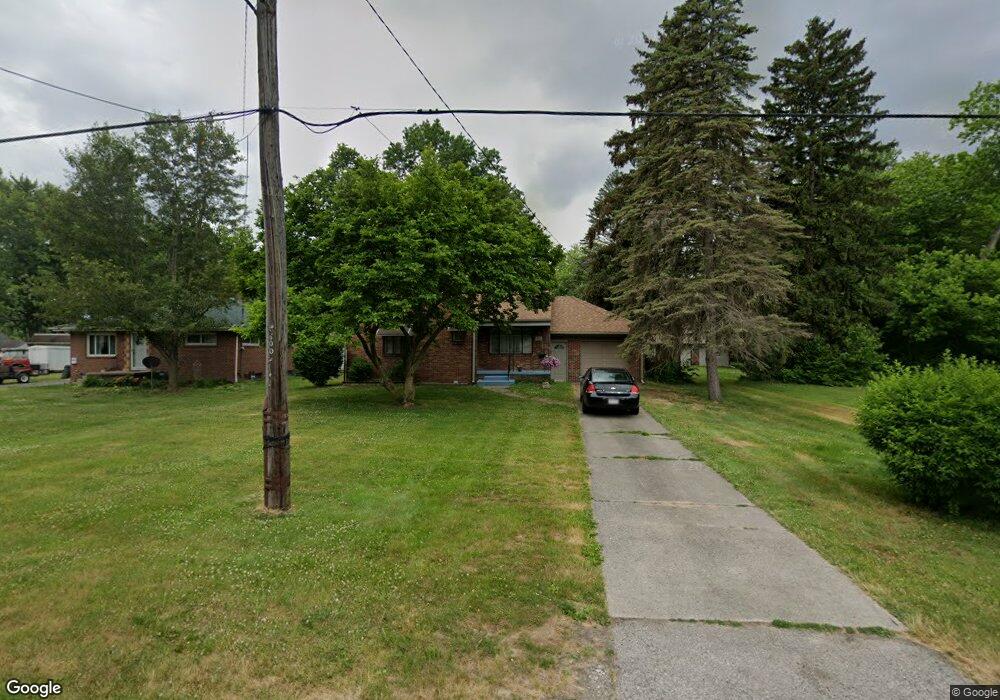
811 Vanderbilt Rd Toledo, OH 43615
Reynolds Corners NeighborhoodEstimated Value: $147,000 - $189,000
2
Beds
2
Baths
1,537
Sq Ft
$111/Sq Ft
Est. Value
About This Home
This home is located at 811 Vanderbilt Rd, Toledo, OH 43615 and is currently estimated at $170,660, approximately $111 per square foot. 811 Vanderbilt Rd is a home located in Lucas County with nearby schools including McTigue Elementary School, Rogers High School, and Horizon Science Academy-Springfield.
Ownership History
Date
Name
Owned For
Owner Type
Purchase Details
Closed on
Oct 23, 2010
Sold by
Sheamer Richard P and Sheamer Barbara A
Bought by
Sheamer Richard P and Sheamer Barbara A
Current Estimated Value
Purchase Details
Closed on
Sep 8, 2010
Sold by
Swonger Karl William and Swonger Natalie W
Bought by
Sheamer Richard P and Sheamer Barbara A
Purchase Details
Closed on
Aug 15, 2001
Sold by
Vandereyk Paul J
Bought by
Sheamer Richard P and Sheamer Barbara
Purchase Details
Closed on
Jun 12, 2001
Sold by
Sheamer Richard R
Bought by
Vandereyk Paul J
Home Financials for this Owner
Home Financials are based on the most recent Mortgage that was taken out on this home.
Original Mortgage
$114,950
Interest Rate
6.25%
Create a Home Valuation Report for This Property
The Home Valuation Report is an in-depth analysis detailing your home's value as well as a comparison with similar homes in the area
Home Values in the Area
Average Home Value in this Area
Purchase History
| Date | Buyer | Sale Price | Title Company |
|---|---|---|---|
| Sheamer Richard P | -- | Attorney | |
| Sheamer Richard P | -- | Attorney | |
| Sheamer Richard P | $121,000 | Metropolitan Title | |
| Vandereyk Paul J | $121,000 | -- |
Source: Public Records
Mortgage History
| Date | Status | Borrower | Loan Amount |
|---|---|---|---|
| Previous Owner | Vandereyk Paul J | $114,950 |
Source: Public Records
Tax History
| Year | Tax Paid | Tax Assessment Tax Assessment Total Assessment is a certain percentage of the fair market value that is determined by local assessors to be the total taxable value of land and additions on the property. | Land | Improvement |
|---|---|---|---|---|
| 2025 | -- | $41,825 | $8,820 | $33,005 |
| 2024 | $1,048 | $41,825 | $8,820 | $33,005 |
| 2023 | $1,859 | $36,050 | $7,840 | $28,210 |
| 2022 | $1,865 | $36,050 | $7,840 | $28,210 |
| 2021 | $1,930 | $36,050 | $7,840 | $28,210 |
| 2020 | $1,729 | $29,575 | $6,440 | $23,135 |
| 2019 | $1,663 | $29,575 | $6,440 | $23,135 |
| 2018 | $1,638 | $29,575 | $6,440 | $23,135 |
| 2017 | $1,558 | $27,440 | $8,225 | $19,215 |
| 2016 | $1,579 | $78,400 | $23,500 | $54,900 |
| 2015 | $1,603 | $78,400 | $23,500 | $54,900 |
| 2014 | $1,176 | $27,450 | $8,230 | $19,220 |
| 2013 | $1,176 | $27,450 | $8,230 | $19,220 |
Source: Public Records
Map
Nearby Homes
- 605 Koch Dr
- 419 N Holland Sylvania Rd
- 914 Sawyer Rd
- 1137 Bedford Woods Dr
- 280 Dulton Dr
- 5845 Cook Dr
- 5665 Camberley Dr
- 1911 N Holland Sylvania Rd
- 630 Saturn Dr
- 1966 Devinci Dr
- 1950 Devinci Dr Unit A203
- 2004 Oakside Rd
- 2015 Oakside Rd
- 2010 Oakside Rd
- 1809 Birdie Dr
- 6324 Bapst Ave
- 5331 Fleet Rd
- 5057 Brandon Rd
- 5041 Ancil Rd
- 405 N Holland Sylvania Rd
- 805 Vanderbilt Rd
- 817 Vanderbilt Rd
- 739 Vanderbilt Rd
- 5835 Globe Ave
- 831 Vanderbilt Rd
- 729 Vanderbilt Rd
- 5837 Globe Ave
- 725 Vanderbilt Rd
- 5843 Globe Ave
- 808 Vanderbilt Rd
- 804 Vanderbilt Rd
- 824 Vanderbilt Rd
- 740 Vanderbilt Rd
- 828 Vanderbilt Rd
- 719 Vanderbilt Rd
- 5847 Globe Ave
- 732 Vanderbilt Rd
- 5814 Fryer Ave
- 5824 Fryer Ave
- 906 Vanderbilt Rd
Your Personal Tour Guide
Ask me questions while you tour the home.