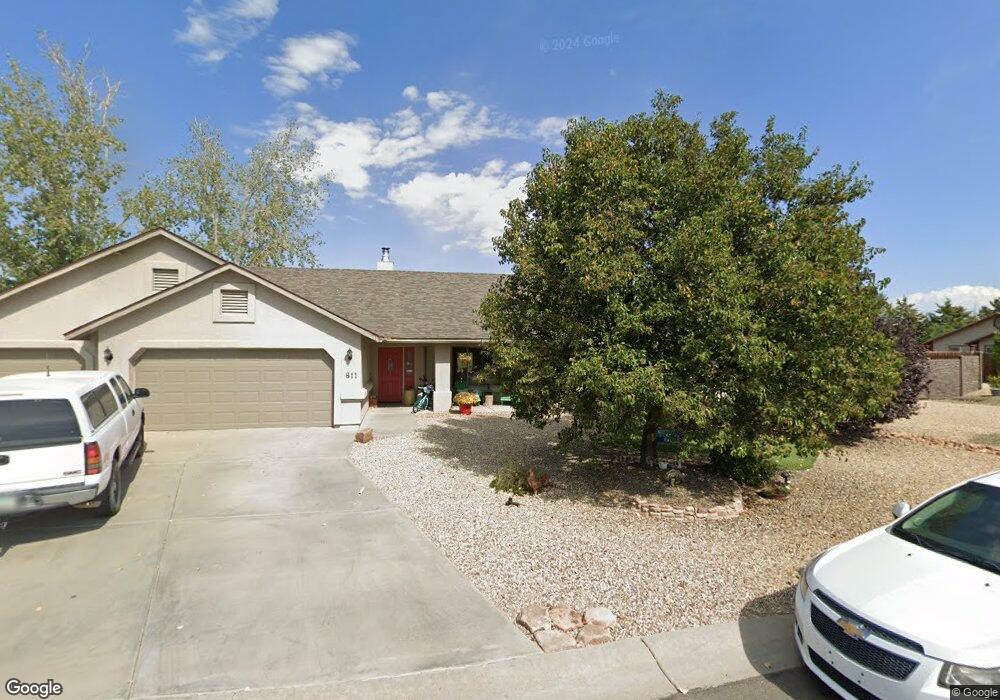
811 Village Cir Chino Valley, AZ 86323
Estimated Value: $473,000 - $582,000
3
Beds
2
Baths
1,509
Sq Ft
$350/Sq Ft
Est. Value
About This Home
This home is located at 811 Village Cir, Chino Valley, AZ 86323 and is currently estimated at $528,474, approximately $350 per square foot. 811 Village Cir is a home located in Yavapai County with nearby schools including Chino Valley High School and SUNRISE ACADEMY.
Ownership History
Date
Name
Owned For
Owner Type
Purchase Details
Closed on
May 22, 2002
Sold by
North Sky Development Corp
Bought by
Mattingly Ian M and Mattingly Julie K
Current Estimated Value
Home Financials for this Owner
Home Financials are based on the most recent Mortgage that was taken out on this home.
Original Mortgage
$137,650
Outstanding Balance
$57,961
Interest Rate
6.89%
Estimated Equity
$470,513
Purchase Details
Closed on
Nov 6, 2001
Sold by
Pickens G Edward
Bought by
North Sky Development Corp
Purchase Details
Closed on
Jul 27, 2001
Sold by
Pickens Carol
Bought by
Pickens G Edward
Purchase Details
Closed on
Mar 2, 1998
Sold by
Parkside Village Llc
Bought by
Pickens G Edward and Pickens Carol
Home Financials for this Owner
Home Financials are based on the most recent Mortgage that was taken out on this home.
Original Mortgage
$25,200
Interest Rate
7.06%
Create a Home Valuation Report for This Property
The Home Valuation Report is an in-depth analysis detailing your home's value as well as a comparison with similar homes in the area
Home Values in the Area
Average Home Value in this Area
Purchase History
| Date | Buyer | Sale Price | Title Company |
|---|---|---|---|
| Mattingly Ian M | $144,900 | Capital Title Agency Inc | |
| North Sky Development Corp | $34,000 | Capital Title Agency Inc | |
| Pickens G Edward | -- | -- | |
| Pickens G Edward | $28,709 | First American Title Ins Co |
Source: Public Records
Mortgage History
| Date | Status | Borrower | Loan Amount |
|---|---|---|---|
| Open | Mattingly Ian M | $137,650 | |
| Previous Owner | Pickens G Edward | $25,200 |
Source: Public Records
Tax History Compared to Growth
Tax History
| Year | Tax Paid | Tax Assessment Tax Assessment Total Assessment is a certain percentage of the fair market value that is determined by local assessors to be the total taxable value of land and additions on the property. | Land | Improvement |
|---|---|---|---|---|
| 2026 | $2,648 | $46,103 | -- | -- |
| 2025 | $2,583 | $46,092 | -- | -- |
| 2024 | $2,583 | $48,690 | -- | -- |
| 2023 | $2,583 | $39,173 | $4,408 | $34,765 |
| 2022 | $2,488 | $32,450 | $2,804 | $29,646 |
| 2021 | $2,573 | $30,895 | $3,432 | $27,463 |
| 2020 | $2,496 | $0 | $0 | $0 |
| 2019 | $2,466 | $0 | $0 | $0 |
| 2018 | $1,346 | $0 | $0 | $0 |
| 2017 | $1,308 | $0 | $0 | $0 |
| 2016 | $1,278 | $0 | $0 | $0 |
| 2015 | $1,214 | $0 | $0 | $0 |
| 2014 | $1,216 | $0 | $0 | $0 |
Source: Public Records
Map
Nearby Homes
- 751 Highland Cir
- 931 E Damion Loop
- 954 Hope Ln
- 1 E Road 1 S
- 0000 S Rd 1
- 1900 S State Route 89
- 725 S Road 1 W
- 1326 E Ben Rd
- 217h N Hwy 89 and Outer Loop Rd
- 860 W Road 1 S
- 1155 W Justray Ranch Rd
- 1-A Daisy Ranch Rd
- 1-B Daisy Ranch Rd
- 753 Willow Ln Unit IV
- 1285 W Justray Ranch Rd
- Tbd E Road 4 1 2 South - Lot 1
- 1827 E Ash Dr
- N Hwy 89 Outer Loop Rd
- 1350 W Justray Ranch Rd
- 1425 W Justray Ranch Rd
- 821 Village Cir
- 801 Village Cir
- 822 Village Cir
- 812 Village Cir
- 802 Village Cir
- 831 Village Cir
- 821 E Road 2 S
- 821 E Road 2 S
- 853 E Road 2 S
- 832 Village Cir
- 709 Park Meadow Dr
- 1150 Parkside Village Dr
- 749 Park Meadow Dr
- 729 Park Meadow Dr
- 1070 Parkside Village Dr
- 710 Park Meadow Dr
- 57 Parkside Village Dr
- 52 Parkside Village Dr
- 39 Parkside Village Dr
- 28 Parkside Village Dr