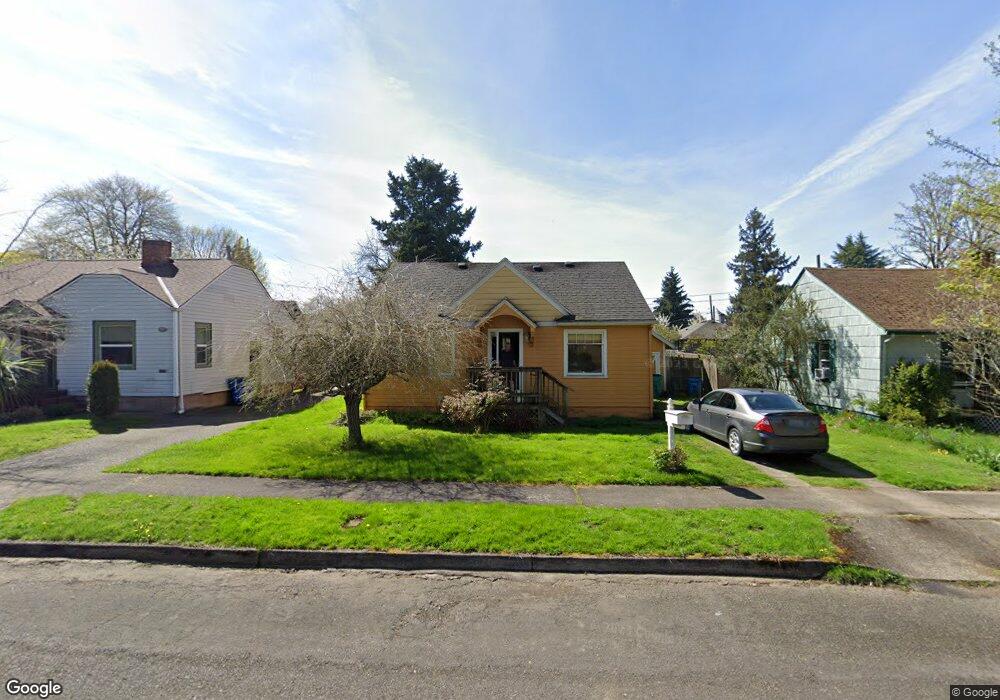
811 W 21st St Vancouver, WA 98660
Hough NeighborhoodEstimated Value: $361,000 - $461,000
2
Beds
1
Bath
780
Sq Ft
$542/Sq Ft
Est. Value
About This Home
This home is located at 811 W 21st St, Vancouver, WA 98660 and is currently estimated at $422,738, approximately $541 per square foot. 811 W 21st St is a home located in Clark County with nearby schools including Hough Elementary School, Discovery Middle School, and Hudson's Bay High School.
Ownership History
Date
Name
Owned For
Owner Type
Purchase Details
Closed on
Jan 19, 2021
Sold by
Hennessy Ina N and Hennessy Stephen S
Bought by
Hennessy Stephen Samuel and Hennessy Ina Naomi
Current Estimated Value
Purchase Details
Closed on
Jun 16, 2006
Sold by
Barry Joseph M
Bought by
Hennessy Stephen S and Hennessy Ina N
Home Financials for this Owner
Home Financials are based on the most recent Mortgage that was taken out on this home.
Original Mortgage
$156,000
Outstanding Balance
$91,613
Interest Rate
6.55%
Mortgage Type
Fannie Mae Freddie Mac
Estimated Equity
$331,125
Purchase Details
Closed on
Apr 9, 2004
Sold by
Metro Housing Llc
Bought by
Barry Joseph M
Home Financials for this Owner
Home Financials are based on the most recent Mortgage that was taken out on this home.
Original Mortgage
$99,900
Interest Rate
4.12%
Mortgage Type
Purchase Money Mortgage
Purchase Details
Closed on
Oct 24, 2003
Sold by
Gardner Stanley Eugene
Bought by
Metro Housing Llc
Create a Home Valuation Report for This Property
The Home Valuation Report is an in-depth analysis detailing your home's value as well as a comparison with similar homes in the area
Home Values in the Area
Average Home Value in this Area
Purchase History
| Date | Buyer | Sale Price | Title Company |
|---|---|---|---|
| Hennessy Stephen Samuel | -- | None Available | |
| Hennessy Stephen S | $195,000 | Stewart Title | |
| Barry Joseph M | $124,900 | First American Title | |
| Metro Housing Llc | $65,000 | Fidelity National Title |
Source: Public Records
Mortgage History
| Date | Status | Borrower | Loan Amount |
|---|---|---|---|
| Open | Hennessy Stephen S | $156,000 | |
| Previous Owner | Barry Joseph M | $99,900 | |
| Closed | Barry Joseph M | $25,000 |
Source: Public Records
Tax History Compared to Growth
Tax History
| Year | Tax Paid | Tax Assessment Tax Assessment Total Assessment is a certain percentage of the fair market value that is determined by local assessors to be the total taxable value of land and additions on the property. | Land | Improvement |
|---|---|---|---|---|
| 2025 | $4,230 | $414,714 | $228,319 | $186,395 |
| 2024 | $3,939 | $433,050 | $228,319 | $204,731 |
| 2023 | $3,835 | $420,983 | $219,038 | $201,945 |
| 2022 | $3,400 | $411,471 | $226,463 | $185,008 |
| 2021 | $3,490 | $339,786 | $185,625 | $154,161 |
| 2020 | $3,069 | $328,838 | $174,839 | $153,999 |
| 2019 | $2,676 | $299,631 | $156,825 | $142,806 |
| 2018 | $2,872 | $270,573 | $0 | $0 |
| 2017 | $2,545 | $241,087 | $0 | $0 |
| 2016 | $2,350 | $222,973 | $0 | $0 |
| 2015 | $2,278 | $196,703 | $0 | $0 |
| 2014 | -- | $180,308 | $0 | $0 |
| 2013 | -- | $173,596 | $0 | $0 |
Source: Public Records
Map
Nearby Homes
- 2009 Kauffman Ave
- 2100 Kauffman Ave
- 2000 Harney St
- 2000 Kauffman Ave
- 2009 Grant St
- 1908 Grant St
- 2413 Markle Ave
- 1108 W Mcloughlin Blvd
- 709 W Fourth Plain Blvd
- 1200 W Mcloughlin Blvd
- 1204 W Mcloughlin Blvd
- 708 W Fourth Plain Blvd
- 400 W 23rd St
- 610 W Fourth Plain Blvd
- 610 W Fourth Plain Blvd Unit A
- 112 W 21st St
- 305 W 16th St
- 501 W 30th St
- 1106 W 30th St
- 205 W 28th St