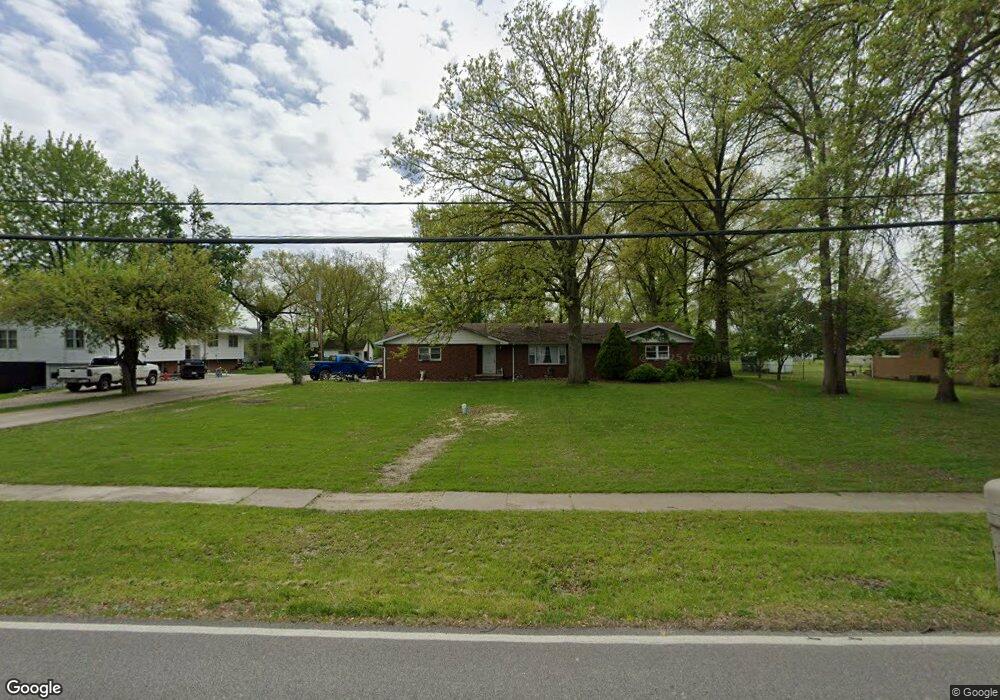
811 W High St Defiance, OH 43512
Estimated Value: $199,000 - $269,070
3
Beds
3
Baths
1,787
Sq Ft
$130/Sq Ft
Est. Value
About This Home
This home is located at 811 W High St, Defiance, OH 43512 and is currently estimated at $231,768, approximately $129 per square foot. 811 W High St is a home located in Defiance County with nearby schools including Defiance Elementary School, Defiance Middle School, and Defiance High School.
Ownership History
Date
Name
Owned For
Owner Type
Purchase Details
Closed on
Feb 9, 2018
Sold by
Horvath Jeffrey J and Church Solonia K
Bought by
Church Joseph O
Current Estimated Value
Home Financials for this Owner
Home Financials are based on the most recent Mortgage that was taken out on this home.
Original Mortgage
$78,000
Outstanding Balance
$55,846
Interest Rate
4.25%
Mortgage Type
Adjustable Rate Mortgage/ARM
Estimated Equity
$175,922
Purchase Details
Closed on
Jul 29, 2009
Sold by
Church Estil B and Church Solonia K
Bought by
Church Estil B and Church Solonia K
Home Financials for this Owner
Home Financials are based on the most recent Mortgage that was taken out on this home.
Original Mortgage
$90,000
Interest Rate
6.5%
Mortgage Type
Adjustable Rate Mortgage/ARM
Purchase Details
Closed on
May 3, 2005
Sold by
Church Estil B and Church Solonia K
Bought by
Church Joseph O
Home Financials for this Owner
Home Financials are based on the most recent Mortgage that was taken out on this home.
Original Mortgage
$30,385
Interest Rate
6.05%
Mortgage Type
Unknown
Purchase Details
Closed on
Jan 17, 1997
Bought by
Church Solonia Kathryn
Create a Home Valuation Report for This Property
The Home Valuation Report is an in-depth analysis detailing your home's value as well as a comparison with similar homes in the area
Home Values in the Area
Average Home Value in this Area
Purchase History
| Date | Buyer | Sale Price | Title Company |
|---|---|---|---|
| Church Joseph O | $95,000 | None Available | |
| Church Estil B | -- | -- | |
| Church Estil B | $70,500 | -- | |
| Church Joseph O | $105,000 | None Available | |
| Church Solonia Kathryn | -- | -- |
Source: Public Records
Mortgage History
| Date | Status | Borrower | Loan Amount |
|---|---|---|---|
| Open | Church Joseph O | $78,000 | |
| Previous Owner | Church Estil B | $90,000 | |
| Previous Owner | Church Joseph O | $30,385 |
Source: Public Records
Tax History Compared to Growth
Tax History
| Year | Tax Paid | Tax Assessment Tax Assessment Total Assessment is a certain percentage of the fair market value that is determined by local assessors to be the total taxable value of land and additions on the property. | Land | Improvement |
|---|---|---|---|---|
| 2024 | $2,977 | $77,290 | $10,140 | $67,150 |
| 2023 | $2,977 | $77,290 | $10,140 | $67,150 |
| 2022 | $2,334 | $54,140 | $9,990 | $44,150 |
| 2021 | $2,334 | $54,140 | $9,990 | $44,150 |
| 2020 | $2,414 | $54,140 | $9,990 | $44,150 |
| 2019 | $2,307 | $51,940 | $9,990 | $41,950 |
| 2018 | $2,189 | $51,940 | $9,990 | $41,950 |
| 2017 | $2,159 | $51,937 | $9,989 | $41,948 |
| 2016 | $2,182 | $50,915 | $9,989 | $40,926 |
| 2015 | $869 | $50,915 | $9,989 | $40,926 |
| 2014 | $869 | $50,915 | $9,989 | $40,926 |
| 2013 | $869 | $50,915 | $9,989 | $40,926 |
| 2012 | $869 | $50,915 | $9,989 | $40,926 |
Source: Public Records
Map
Nearby Homes