Estimated Value: $252,000 - $266,000
3
Beds
2
Baths
1,504
Sq Ft
$172/Sq Ft
Est. Value
About This Home
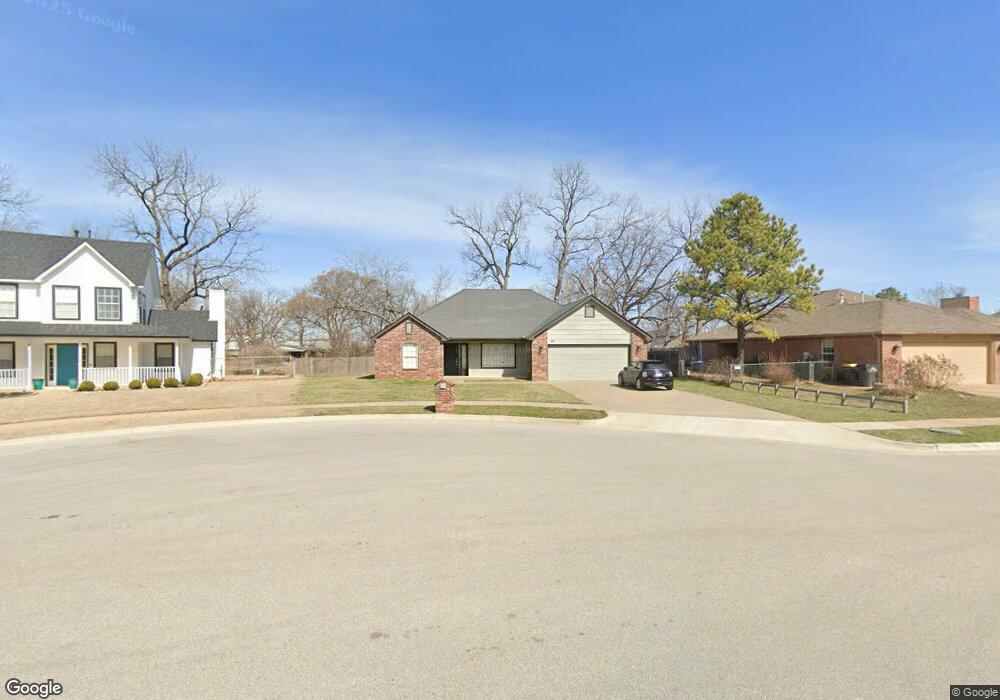
This home is located at 811 W J St, Jenks, OK 74037 and is currently estimated at $259,044, approximately $172 per square foot. 811 W J St is a home located in Tulsa County with nearby schools including Jenks West Elementary School, Jenks West Intermediate Elementary School, and Jenks Middle School.
Ownership History
Date
Name
Owned For
Owner Type
Purchase Details
Closed on
Jun 15, 2011
Sold by
Gladstone Leslie T and Bankruptcy Estate Of Scott T &
Bought by
Brand Torris M and Brand Shelly L
Current Estimated Value
Home Financials for this Owner
Home Financials are based on the most recent Mortgage that was taken out on this home.
Original Mortgage
$94,125
Outstanding Balance
$64,979
Interest Rate
4.66%
Mortgage Type
New Conventional
Estimated Equity
$194,065
Purchase Details
Closed on
May 1, 1997
Create a Home Valuation Report for This Property
The Home Valuation Report is an in-depth analysis detailing your home's value as well as a comparison with similar homes in the area
Home Values in the Area
Average Home Value in this Area
Purchase History
| Date | Buyer | Sale Price | Title Company |
|---|---|---|---|
| Brand Torris M | $125,500 | Frisco Title Corporation | |
| -- | $20,000 | -- |
Source: Public Records
Mortgage History
| Date | Status | Borrower | Loan Amount |
|---|---|---|---|
| Open | Brand Torris M | $94,125 |
Source: Public Records
Tax History Compared to Growth
Tax History
| Year | Tax Paid | Tax Assessment Tax Assessment Total Assessment is a certain percentage of the fair market value that is determined by local assessors to be the total taxable value of land and additions on the property. | Land | Improvement |
|---|---|---|---|---|
| 2024 | $1,843 | $14,940 | $2,287 | $12,653 |
| 2023 | $1,843 | $15,475 | $2,410 | $13,065 |
| 2022 | $1,803 | $14,025 | $3,198 | $10,827 |
| 2021 | $1,769 | $13,587 | $3,098 | $10,489 |
| 2020 | $1,676 | $13,162 | $3,001 | $10,161 |
| 2019 | $1,635 | $12,750 | $2,907 | $9,843 |
| 2018 | $936 | $7,250 | $2,755 | $4,495 |
| 2017 | $921 | $8,250 | $3,135 | $5,115 |
| 2016 | $1,796 | $13,805 | $3,135 | $10,670 |
| 2015 | $1,830 | $13,805 | $3,135 | $10,670 |
| 2014 | $1,872 | $13,805 | $3,135 | $10,670 |
Source: Public Records
Map
Nearby Homes
- 807 W J St
- 803 W J St
- 1008 N Forest Place
- 812 W J St
- 820 N Forest Place
- 917 N Fir St
- 921 N Fir St
- 816 N Forest Place
- 905 N Fir St
- 1018 N Forest Place
- 929 N Fir St
- 1005 N Forest Place
- 1001 N Forest Place
- 1009 N Forest Place
- 825 N Fir St
- 823 N Forest Place
- 812 N Forest Place
- 816 W K Place
- 1011 N Forest Place