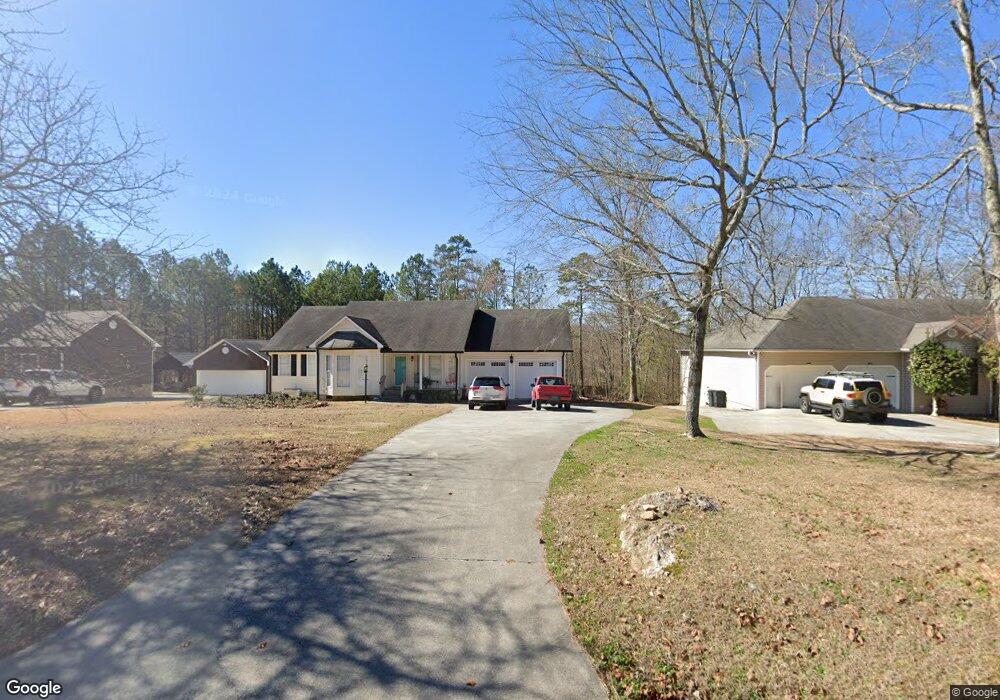
811 Ward Mountain Rd Kingston, GA 30145
Estimated Value: $421,000 - $512,000
--
Bed
4
Baths
2,164
Sq Ft
$211/Sq Ft
Est. Value
About This Home
This home is located at 811 Ward Mountain Rd, Kingston, GA 30145 and is currently estimated at $456,719, approximately $211 per square foot. 811 Ward Mountain Rd is a home located in Floyd County with nearby schools including Model Middle School and Model High School.
Ownership History
Date
Name
Owned For
Owner Type
Purchase Details
Closed on
Nov 8, 2017
Sold by
Henson Johathan L
Bought by
Hambright John Martin and Hambright Debra Anne
Current Estimated Value
Home Financials for this Owner
Home Financials are based on the most recent Mortgage that was taken out on this home.
Original Mortgage
$170,940
Outstanding Balance
$142,360
Interest Rate
3.62%
Mortgage Type
FHA
Estimated Equity
$314,359
Purchase Details
Closed on
Jul 6, 2001
Sold by
Cochran Sheri
Bought by
Henson Linda L and Henson Johathan L
Purchase Details
Closed on
Oct 21, 1999
Sold by
Brown Bernard
Bought by
Cochran Sheri
Purchase Details
Closed on
Jun 10, 1998
Sold by
Montgomery James G
Bought by
Brown Bernard
Purchase Details
Closed on
Nov 25, 1997
Bought by
Ward Mountain Estates Inc
Purchase Details
Closed on
Feb 27, 1997
Sold by
Ward Mountain Estates Inc
Bought by
Montgomery James G
Create a Home Valuation Report for This Property
The Home Valuation Report is an in-depth analysis detailing your home's value as well as a comparison with similar homes in the area
Home Values in the Area
Average Home Value in this Area
Purchase History
| Date | Buyer | Sale Price | Title Company |
|---|---|---|---|
| Hambright John Martin | $210,000 | -- | |
| Henson Linda L | $20,000 | -- | |
| Cochran Sheri | $35,000 | -- | |
| Brown Bernard | $38,000 | -- | |
| Ward Mountain Estates Inc | -- | -- | |
| Montgomery James G | $148,300 | -- |
Source: Public Records
Mortgage History
| Date | Status | Borrower | Loan Amount |
|---|---|---|---|
| Open | Hambright John Martin | $170,940 |
Source: Public Records
Tax History Compared to Growth
Tax History
| Year | Tax Paid | Tax Assessment Tax Assessment Total Assessment is a certain percentage of the fair market value that is determined by local assessors to be the total taxable value of land and additions on the property. | Land | Improvement |
|---|---|---|---|---|
| 2024 | $4,730 | $152,644 | $29,198 | $123,446 |
| 2023 | $4,367 | $146,440 | $26,544 | $119,896 |
| 2022 | $3,323 | $111,983 | $21,678 | $90,305 |
| 2021 | $2,617 | $86,686 | $19,788 | $66,898 |
| 2020 | $2,477 | $81,375 | $17,207 | $64,168 |
| 2019 | $2,360 | $78,559 | $17,207 | $61,352 |
| 2018 | $2,250 | $74,786 | $16,388 | $58,398 |
| 2017 | $2,039 | $67,624 | $15,174 | $52,450 |
| 2016 | $1,889 | $66,656 | $15,160 | $51,496 |
| 2015 | $1,851 | $66,656 | $15,160 | $51,496 |
| 2014 | $1,851 | $66,656 | $15,160 | $51,496 |
Source: Public Records
Map
Nearby Homes
- 890 Ward Mountain Rd
- 1644 Wayside Rd NE
- 0 Sunny Heights Dr NE Unit 20763412
- 0 Sunny Heights Dr NE Unit 10488106
- 489 Barron Rd NE
- 107 Whispering Pines NE
- 105 Whispering Pines NE
- 84 Harris Rd NE
- 3 NE Page Dr
- 29 Woodcliffe Dr NE
- 24 Woodcliffe Dr NE
- 3349 Calhoun Rd NE
- 21 Fernwood Way NE
- 818 Morrison Camp Ground Rd NE
- 18 Marlynn Dr NE
- 637 Wayside Rd NE
- 0 Mcclain Rd Unit 10537234
- 1055 E Hermitage Rd NE
- 96 Collins Rd NE
- 608 Wayside Rd NE
- 811 Ward Mountain Rd
- 837 Ward Mountain Rd
- 847 Ward Mountain Rd
- 847 Ward Mountain Rd
- 827 Ward Mountain Rd
- 801 Ward Mountain Rd
- 857 Ward Mountain Rd
- 875 Ward Mountain Rd
- 863 Ward Mountain Rd
- 889 Ward Mountain Rd
- 901 Ward Mountain Rd
- 844 Ward Mountain Rd
- 785 Ward Mountain Rd
- 820 Ward Mountain Rd
- 834 Ward Mountain Rd
- 874 Ward Mountain Rd
- 919 Ward Mountain Rd
- 799 Ward Mountain Rd
- 767 Ward Mountain Rd
- 786 Ward Mountain Rd