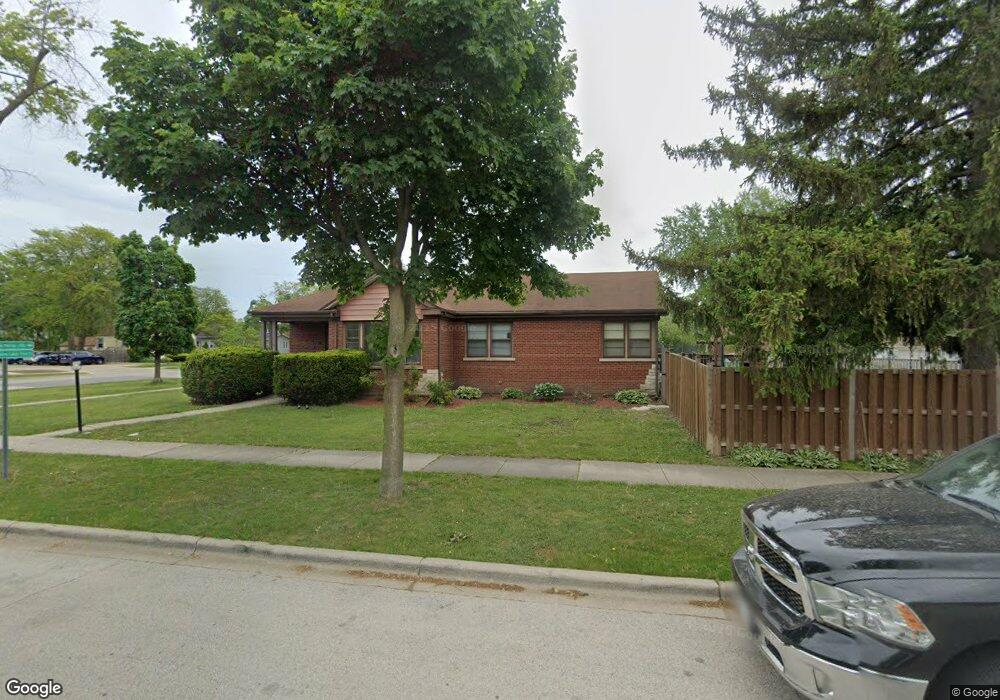
811 Webster Ln Des Plaines, IL 60016
Estimated Value: $425,000 - $472,393
4
Beds
2
Baths
2,250
Sq Ft
$203/Sq Ft
Est. Value
About This Home
This home is located at 811 Webster Ln, Des Plaines, IL 60016 and is currently estimated at $457,598, approximately $203 per square foot. 811 Webster Ln is a home located in Cook County with nearby schools including Forest Elementary School, Algonquin Middle School, and Maine West High School.
Ownership History
Date
Name
Owned For
Owner Type
Purchase Details
Closed on
Oct 23, 2009
Sold by
Wright Michael J
Bought by
Wright Michael J and Torres Marisol Medina
Current Estimated Value
Home Financials for this Owner
Home Financials are based on the most recent Mortgage that was taken out on this home.
Original Mortgage
$215,710
Outstanding Balance
$139,990
Interest Rate
4.96%
Mortgage Type
FHA
Estimated Equity
$317,608
Purchase Details
Closed on
May 27, 1999
Sold by
Frank Ann Marie and Frank Kurt G
Bought by
Wright Michael J
Home Financials for this Owner
Home Financials are based on the most recent Mortgage that was taken out on this home.
Original Mortgage
$200,000
Interest Rate
6.94%
Purchase Details
Closed on
Oct 26, 1993
Sold by
Agrusa Frank and Agrusa Sandra
Bought by
Frank Kurt G and Frank Ann Marie
Home Financials for this Owner
Home Financials are based on the most recent Mortgage that was taken out on this home.
Original Mortgage
$177,500
Interest Rate
7%
Create a Home Valuation Report for This Property
The Home Valuation Report is an in-depth analysis detailing your home's value as well as a comparison with similar homes in the area
Home Values in the Area
Average Home Value in this Area
Purchase History
| Date | Buyer | Sale Price | Title Company |
|---|---|---|---|
| Wright Michael J | -- | Law Title Insurance | |
| Wright Michael J | $253,500 | -- | |
| Frank Kurt G | $135,000 | -- |
Source: Public Records
Mortgage History
| Date | Status | Borrower | Loan Amount |
|---|---|---|---|
| Open | Wright Michael J | $215,710 | |
| Closed | Wright Michael J | $200,000 | |
| Previous Owner | Frank Kurt G | $177,500 |
Source: Public Records
Tax History Compared to Growth
Tax History
| Year | Tax Paid | Tax Assessment Tax Assessment Total Assessment is a certain percentage of the fair market value that is determined by local assessors to be the total taxable value of land and additions on the property. | Land | Improvement |
|---|---|---|---|---|
| 2024 | $8,192 | $32,050 | $9,912 | $22,138 |
| 2023 | $8,803 | $34,387 | $9,912 | $24,475 |
| 2022 | $8,803 | $37,630 | $9,912 | $27,718 |
| 2021 | $7,522 | $27,801 | $7,929 | $19,872 |
| 2020 | $8,596 | $31,547 | $7,929 | $23,618 |
| 2019 | $8,511 | $35,053 | $7,929 | $27,124 |
| 2018 | $6,953 | $26,684 | $6,938 | $19,746 |
| 2017 | $7,024 | $27,284 | $6,938 | $20,346 |
| 2016 | $6,888 | $27,284 | $6,938 | $20,346 |
| 2015 | $6,481 | $24,062 | $5,947 | $18,115 |
| 2014 | $6,361 | $24,062 | $5,947 | $18,115 |
| 2013 | $7,217 | $27,640 | $5,947 | $21,693 |
Source: Public Records
Map
Nearby Homes
- 881 E Thacker St
- 886 E Thacker St
- 858 E Grant Dr
- 911 E Villa Dr
- 648 1st Ave
- 714 E Thacker St
- 915 Graceland Ave Unit 1E
- 1056 E Villa Dr
- 1057 Hollywood Ave
- 799 Graceland Ave Unit 504A
- 514 S 4th Ave
- 879 North Ave
- 1157 W Grant Dr
- 890 North Ave
- 1365 Ashland Ave Unit 302
- 843 Lexington Cir E
- 1380 Oakwood Ave Unit 306
- 906 Alfini Dr
- 520 E Thacker St
- 821 Lexington Cir E
- 975 E Thacker St
- 835 Webster Ln
- 839 Webster Ln
- 830 S 2nd Ave
- 991 E Thacker St
- 933 E Thacker St
- 828 Webster Ln
- 851 Webster Ln
- 836 S 2nd Ave
- 840 Webster Ln
- 980 E Thacker St
- 925 E Thacker St
- 859 Webster Ln
- 992 E Thacker St
- 850 Webster Ln
- 936 E Thacker St
- 852 S 2nd Ave
- 928 E Thacker St
- 856 Webster Ln
- 867 Webster Ln