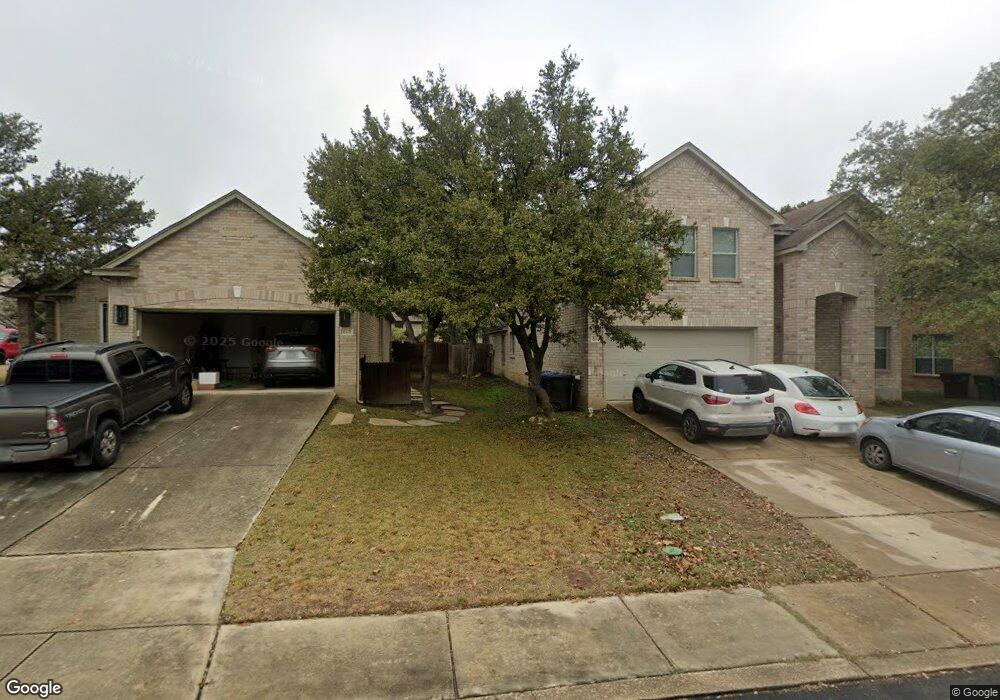
8111 Cooper Mill San Antonio, TX 78255
Estimated Value: $431,772 - $444,000
5
Beds
3
Baths
3,409
Sq Ft
$129/Sq Ft
Est. Value
About This Home
This home is located at 8111 Cooper Mill, San Antonio, TX 78255 and is currently estimated at $439,443, approximately $128 per square foot. 8111 Cooper Mill is a home located in Bexar County with nearby schools including Aue Elementary School, Rawlinson Middle School, and Clark High School.
Ownership History
Date
Name
Owned For
Owner Type
Purchase Details
Closed on
Jul 31, 2024
Sold by
Poll Robert M
Bought by
Poll Blanca A
Current Estimated Value
Purchase Details
Closed on
May 18, 2010
Sold by
Fannie Mae
Bought by
Poll Robert and Poll Blanca
Home Financials for this Owner
Home Financials are based on the most recent Mortgage that was taken out on this home.
Original Mortgage
$214,515
Interest Rate
5.14%
Mortgage Type
VA
Purchase Details
Closed on
Jan 5, 2010
Sold by
Arias Sergio
Bought by
Federal National Mortgage Association
Purchase Details
Closed on
Nov 13, 2006
Sold by
Kb Home Lone Star Lp
Bought by
Arias Sergio
Home Financials for this Owner
Home Financials are based on the most recent Mortgage that was taken out on this home.
Original Mortgage
$227,548
Interest Rate
7.12%
Mortgage Type
Purchase Money Mortgage
Create a Home Valuation Report for This Property
The Home Valuation Report is an in-depth analysis detailing your home's value as well as a comparison with similar homes in the area
Home Values in the Area
Average Home Value in this Area
Purchase History
| Date | Buyer | Sale Price | Title Company |
|---|---|---|---|
| Poll Blanca A | -- | None Listed On Document | |
| Poll Robert | -- | Trinity Title Of Texas Llc | |
| Federal National Mortgage Association | $207,871 | None Available | |
| Arias Sergio | -- | Alamo Title Company |
Source: Public Records
Mortgage History
| Date | Status | Borrower | Loan Amount |
|---|---|---|---|
| Previous Owner | Poll Robert | $214,515 | |
| Previous Owner | Arias Sergio | $227,548 |
Source: Public Records
Tax History Compared to Growth
Tax History
| Year | Tax Paid | Tax Assessment Tax Assessment Total Assessment is a certain percentage of the fair market value that is determined by local assessors to be the total taxable value of land and additions on the property. | Land | Improvement |
|---|---|---|---|---|
| 2025 | $7,424 | $455,085 | $83,360 | $374,160 |
| 2024 | $7,424 | $413,714 | $83,360 | $378,670 |
| 2023 | $7,424 | $376,104 | $83,360 | $397,230 |
| 2022 | $8,464 | $341,913 | $65,290 | $372,920 |
| 2021 | $7,968 | $310,830 | $42,820 | $268,010 |
| 2020 | $7,769 | $297,810 | $42,820 | $254,990 |
| 2019 | $7,983 | $298,000 | $42,820 | $255,180 |
| 2018 | $7,569 | $282,360 | $42,820 | $239,540 |
| 2017 | $7,367 | $274,360 | $42,820 | $231,540 |
| 2016 | $7,193 | $267,880 | $42,820 | $225,060 |
| 2015 | $5,933 | $250,337 | $36,550 | $216,680 |
| 2014 | $5,933 | $227,579 | $0 | $0 |
Source: Public Records
Map
Nearby Homes
- 8110 Cooper Corral Cir
- 8111 Jalane Park
- 25127 Royal Land
- 25151 Buttermilk Ln
- 8219 Wayside Creek
- 14728 Childress Falls
- 8312 Merchants Lodge
- 24442 Buck Creek
- 24423 Elise Falls
- 24831 Cloudy Creek
- 24915 White Creek
- 7811 Midnight Stage
- 24406 Treaty Creek
- 25410 Tidal Creek
- 24406 Flint Creek
- 8019 Jalane Oaks
- 8226 Two Winds
- 24710 Cloudy Creek
- 8503 Silent Creek
- 8343 Bordeaux Bay
- 8107 Cooper Mill
- 8115 Cooper Mill
- 8103 Cooper Mill
- 8114 Cooper Corral Cir
- 8118 Cooper Corral Cir
- 8106 Cooper Corral Cir
- 8031 Cooper Mill
- 8110 Cooper Mill
- 8114 Cooper Mill
- 8106 Cooper Mill
- 8118 Cooper Mill
- 25011 Cooper Cir
- 8102 Cooper Corral Cir
- 25007 Cooper Cir
- 25015 Cooper Cir
- 8102 Cooper Mill
- 8027 Cooper Mill
- 25019 Cooper Cir
- 8122 Cooper Mill
- 8030 Cooper Corral