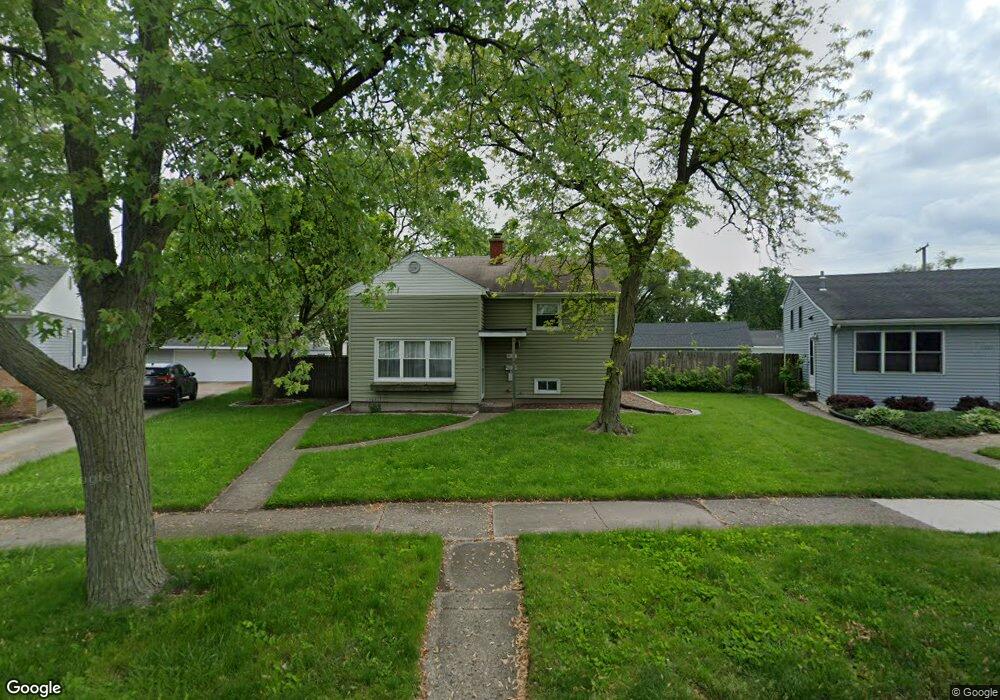
8111 E 4th Place Highland, IN 46322
Estimated Value: $244,990 - $298,000
3
Beds
1
Bath
1,200
Sq Ft
$223/Sq Ft
Est. Value
About This Home
This home is located at 8111 E 4th Place, Highland, IN 46322 and is currently estimated at $267,998, approximately $223 per square foot. 8111 E 4th Place is a home located in Lake County with nearby schools including Highland High School, Highland Christian School, and Our Lady Of Grace School.
Ownership History
Date
Name
Owned For
Owner Type
Purchase Details
Closed on
Dec 30, 2011
Sold by
Biegel Mark D and Biegel Marissa D
Bought by
Sopcich Brian T and Sopcich Jillian N
Current Estimated Value
Home Financials for this Owner
Home Financials are based on the most recent Mortgage that was taken out on this home.
Original Mortgage
$131,100
Outstanding Balance
$88,523
Interest Rate
3.97%
Mortgage Type
New Conventional
Estimated Equity
$179,475
Purchase Details
Closed on
Sep 10, 2008
Sold by
Fannie Mae
Bought by
Biegel Mark D and Biegel Marissa D
Home Financials for this Owner
Home Financials are based on the most recent Mortgage that was taken out on this home.
Original Mortgage
$85,500
Interest Rate
6.41%
Mortgage Type
Purchase Money Mortgage
Purchase Details
Closed on
May 2, 2008
Sold by
Walden Violet N and Walden William H
Bought by
Federal National Mortgage Association
Create a Home Valuation Report for This Property
The Home Valuation Report is an in-depth analysis detailing your home's value as well as a comparison with similar homes in the area
Home Values in the Area
Average Home Value in this Area
Purchase History
| Date | Buyer | Sale Price | Title Company |
|---|---|---|---|
| Sopcich Brian T | -- | Fidelity Cp | |
| Biegel Mark D | -- | Title One | |
| Federal National Mortgage Association | $136,499 | None Available |
Source: Public Records
Mortgage History
| Date | Status | Borrower | Loan Amount |
|---|---|---|---|
| Open | Sopcich Brian T | $131,100 | |
| Previous Owner | Biegel Mark D | $85,500 |
Source: Public Records
Tax History
| Year | Tax Paid | Tax Assessment Tax Assessment Total Assessment is a certain percentage of the fair market value that is determined by local assessors to be the total taxable value of land and additions on the property. | Land | Improvement |
|---|---|---|---|---|
| 2025 | $2,285 | $231,000 | $41,900 | $189,100 |
| 2024 | $2,285 | $215,100 | $41,900 | $173,200 |
| 2023 | $1,793 | $205,800 | $41,900 | $163,900 |
| 2022 | $1,793 | $184,100 | $41,900 | $142,200 |
| 2021 | $1,552 | $158,800 | $24,800 | $134,000 |
| 2020 | $1,425 | $154,000 | $24,800 | $129,200 |
| 2019 | $1,524 | $147,900 | $24,800 | $123,100 |
| 2018 | $1,541 | $140,100 | $24,800 | $115,300 |
| 2017 | $1,519 | $136,200 | $24,800 | $111,400 |
| 2016 | $1,536 | $137,700 | $24,800 | $112,900 |
| 2014 | $1,329 | $135,400 | $24,800 | $110,600 |
| 2013 | $1,151 | $125,800 | $24,800 | $101,000 |
Source: Public Records
Map
Nearby Homes
- 3107 Eder St
- 8023 Richard St
- 8327 Kennedy Ave
- 8022 Sycamore Ave
- 2929 Garfield Ave
- 2517 River Dr
- 2447 81st St
- 8129 Wicker Park Dr
- 3230 Garfield Ave
- 3428 Ross Place
- 3244 176th Place
- 3246 176th St
- 3230 175th Place
- 2912 Cambridge Way
- 2892 Cambridge Way
- 8822 Saint James Place
- 3504 Garfield Ave
- 3233 Ridge Rd
- 7411 Marshall Ave
- 2711 Clough Ave
Your Personal Tour Guide
Ask me questions while you tour the home.