Estimated Value: $246,656 - $337,000
3
Beds
2
Baths
1,350
Sq Ft
$202/Sq Ft
Est. Value
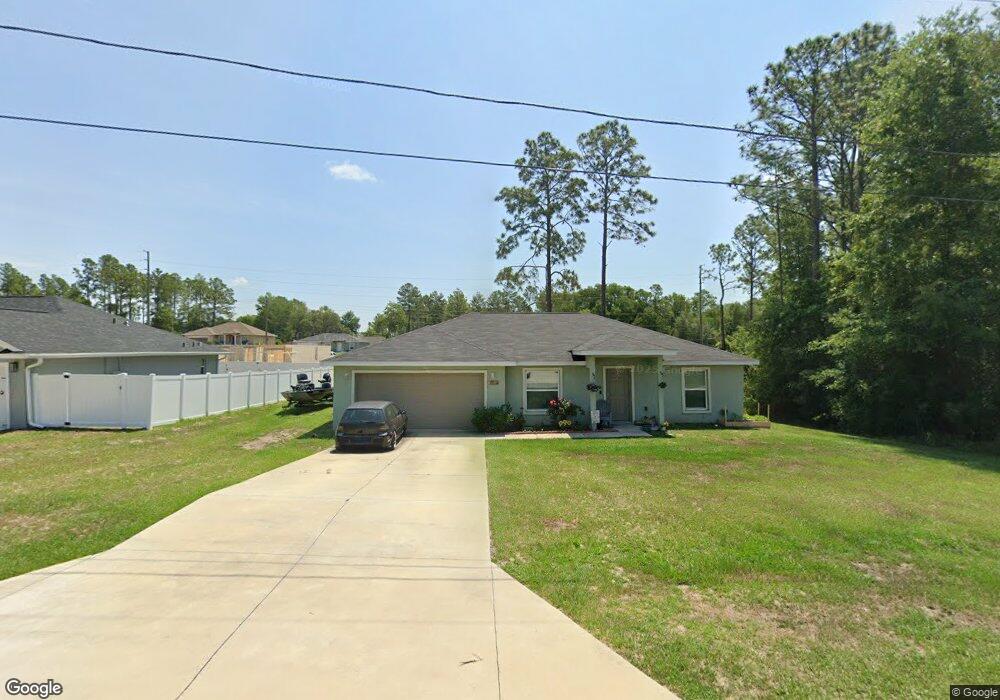
About This Home
This home is located at 8111 SW 132nd Loop, Ocala, FL 34473 and is currently estimated at $272,664, approximately $201 per square foot. 8111 SW 132nd Loop is a home with nearby schools including Marion Oaks Elementary School, Horizon Academy At Marion Oaks, and Dunnellon High School.
Ownership History
Date
Name
Owned For
Owner Type
Purchase Details
Closed on
Jun 10, 2020
Sold by
Southern Impression Homes Llc
Bought by
Cap Ocala 5 Llc
Current Estimated Value
Purchase Details
Closed on
Dec 22, 2017
Sold by
Alma Inestment Properties Llc
Bought by
Southern Impression Homes Llc
Purchase Details
Closed on
Jun 1, 2017
Bought by
Alma Investment Properties Llc
Purchase Details
Closed on
May 12, 2017
Sold by
Rj Proeprties Inc
Bought by
Alma Inbestments Properties Llc
Purchase Details
Closed on
Mar 1, 2017
Bought by
Alma Investment Properties Llc
Purchase Details
Closed on
Nov 16, 2009
Sold by
Daniels Rainer
Bought by
R J Properties & Consulting Inc
Purchase Details
Closed on
Sep 17, 2009
Sold by
Daniels Rainer J and Daniels Ranier
Bought by
R J Properties & Consulting Inc
Purchase Details
Closed on
Jan 10, 2006
Sold by
Richards Janet
Bought by
Daniels Ranier
Create a Home Valuation Report for This Property
The Home Valuation Report is an in-depth analysis detailing your home's value as well as a comparison with similar homes in the area
Home Values in the Area
Average Home Value in this Area
Purchase History
| Date | Buyer | Sale Price | Title Company |
|---|---|---|---|
| Cap Ocala 5 Llc | $149,900 | First International Ttl Inc | |
| Southern Impression Homes Llc | -- | Attorney | |
| Alma Investment Properties Llc | $4,000 | -- | |
| Alma Inbestments Properties Llc | $40,000 | First Intl Title Inc | |
| Alma Investment Properties Llc | $100 | -- | |
| R J Properties & Consulting Inc | -- | Gold Crest Title Services | |
| R J Properties & Consulting Inc | -- | Gold Crest Title Services | |
| Daniels Ranier | $40,000 | Title Offices Llc |
Source: Public Records
Tax History
| Year | Tax Paid | Tax Assessment Tax Assessment Total Assessment is a certain percentage of the fair market value that is determined by local assessors to be the total taxable value of land and additions on the property. | Land | Improvement |
|---|---|---|---|---|
| 2025 | $3,779 | $187,651 | -- | -- |
| 2024 | $3,389 | $170,592 | -- | -- |
| 2023 | $3,271 | $155,084 | $0 | $0 |
| 2022 | $2,949 | $140,985 | $0 | $0 |
| 2021 | $2,615 | $128,168 | $5,100 | $123,068 |
| 2020 | $180 | $4,800 | $4,800 | $0 |
| 2019 | $190 | $5,350 | $5,350 | $0 |
| 2018 | $182 | $5,050 | $5,050 | $0 |
| 2017 | $149 | $3,100 | $3,100 | $0 |
| 2016 | $146 | $2,890 | $0 | $0 |
| 2015 | $162 | $3,740 | $0 | $0 |
| 2014 | $157 | $3,400 | $0 | $0 |
Source: Public Records
Map
Nearby Homes
- 8040 SW 131st Ln
- 13974 SW 79th Terrace
- 13047 SW 79th Cir
- 0 SW 82nd Court Rd Unit MFRO6338668
- 13023 SW 79th Cir
- 8014 SW 135th Street Rd Unit 8
- 0 SW 83rd Cir Unit 14
- 0 SW 83rd Cir Unit 15
- TBD SW 135th Street Rd
- 0 SW 135th Street Rd Unit 20 MFRO6314911
- 13145 SW 78th Cir
- 8290 SW 131st Ln
- 8182 SW 135th Street Rd
- 13081 SW 78th Cir
- 8413 SW 131st Ln
- 8001 SW 135th Loop
- 13392 SW 77th Ave
- 785 Marion Oaks Trail
- 783 Marion Oaks Trail
- 12966 SW 82nd Avenue Rd
- 8121 SW 132 Loop
- 14566 SW 69th Court Rd
- 8118 SW 132nd Loop
- 8118 SW 132 Loop
- 8096 SW 132nd Loop
- 8106 SW 132nd Loop
- 8080 SW 132 Loop
- 8096 SW 132 Loop
- 00 SW 132nd Loop
- 8081 SW 132 Loop
- 13199 SW 83rd Cir
- 8011 SW Highway 484
- 8013 SW Highway 484
- 8013 SW Hwy 484
- 8015 SW Highway 484
- 13111 SW 79th Cir
- 8065 SW 133rd Ln
- 8012-1455-17 SW 133rd Ln
- 8019 SW Highway 484
- 8019 SW Hwy 484
Your Personal Tour Guide
Ask me questions while you tour the home.