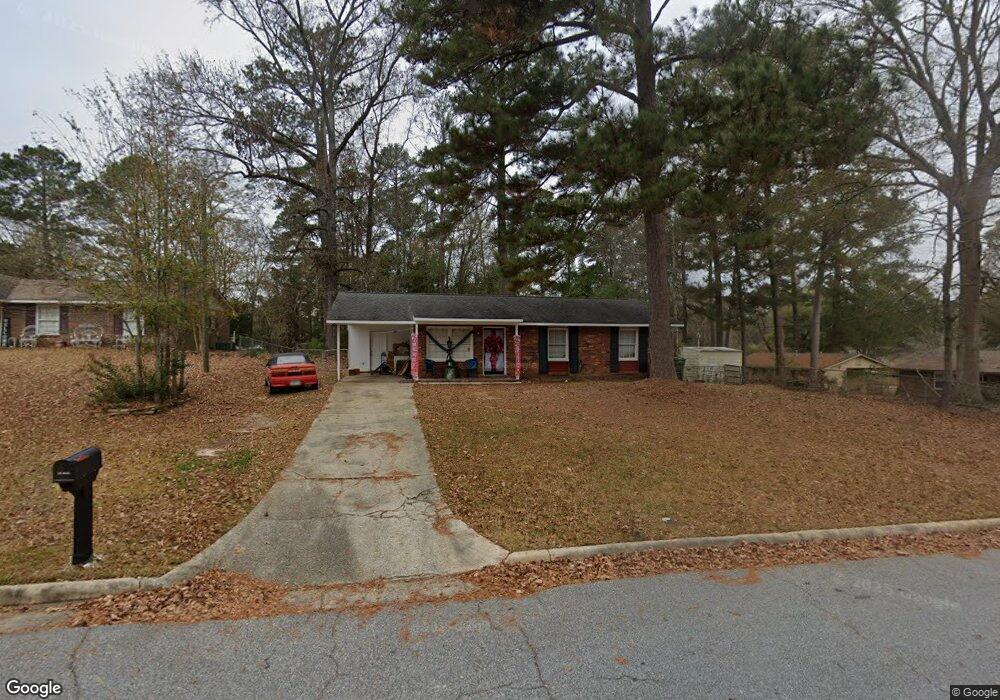
8111 Trafalgar Way Columbus, GA 31904
North Columbus NeighborhoodEstimated Value: $146,000 - $158,594
3
Beds
2
Baths
1,026
Sq Ft
$148/Sq Ft
Est. Value
About This Home
This home is located at 8111 Trafalgar Way, Columbus, GA 31904 and is currently estimated at $152,149, approximately $148 per square foot. 8111 Trafalgar Way is a home located in Muscogee County with nearby schools including Double Churches Elementary School, Veterans Memorial Middle School, and Northside High School.
Ownership History
Date
Name
Owned For
Owner Type
Purchase Details
Closed on
Nov 2, 2020
Sold by
Luciani Luis Estate
Bought by
Santiago John M
Current Estimated Value
Home Financials for this Owner
Home Financials are based on the most recent Mortgage that was taken out on this home.
Original Mortgage
$98,000
Outstanding Balance
$86,703
Interest Rate
2.8%
Mortgage Type
VA
Estimated Equity
$65,446
Purchase Details
Closed on
Aug 22, 2007
Sold by
Gurney Llc
Bought by
Luciani Luis
Home Financials for this Owner
Home Financials are based on the most recent Mortgage that was taken out on this home.
Original Mortgage
$9,790
Interest Rate
6.7%
Mortgage Type
Credit Line Revolving
Purchase Details
Closed on
Jul 8, 2005
Sold by
Chapleau Kristopher D and Chapleau Jamie B
Bought by
Richardson Rebecca M
Create a Home Valuation Report for This Property
The Home Valuation Report is an in-depth analysis detailing your home's value as well as a comparison with similar homes in the area
Home Values in the Area
Average Home Value in this Area
Purchase History
| Date | Buyer | Sale Price | Title Company |
|---|---|---|---|
| Santiago John M | $98,000 | -- | |
| Luciani Luis | $98,000 | None Available | |
| Richardson Rebecca M | $23,750 | None Available |
Source: Public Records
Mortgage History
| Date | Status | Borrower | Loan Amount |
|---|---|---|---|
| Open | Santiago John M | $98,000 | |
| Previous Owner | Luciani Luis | $9,790 | |
| Previous Owner | Luciani Luis | $78,400 |
Source: Public Records
Tax History Compared to Growth
Tax History
| Year | Tax Paid | Tax Assessment Tax Assessment Total Assessment is a certain percentage of the fair market value that is determined by local assessors to be the total taxable value of land and additions on the property. | Land | Improvement |
|---|---|---|---|---|
| 2025 | -- | $49,180 | $8,640 | $40,540 |
| 2024 | -- | $49,180 | $8,640 | $40,540 |
| 2023 | $277 | $49,180 | $8,640 | $40,540 |
| 2022 | $1,006 | $42,216 | $8,640 | $33,576 |
| 2021 | $999 | $37,868 | $8,640 | $29,228 |
| 2020 | $1,468 | $35,936 | $8,640 | $27,296 |
| 2019 | $1,472 | $35,936 | $8,640 | $27,296 |
| 2018 | $1,472 | $35,936 | $8,640 | $27,296 |
| 2017 | $1,477 | $35,936 | $8,640 | $27,296 |
| 2016 | $1,606 | $38,934 | $4,735 | $34,199 |
| 2015 | $1,608 | $38,934 | $4,735 | $34,199 |
| 2014 | $644 | $38,934 | $4,735 | $34,199 |
| 2013 | -- | $38,934 | $4,735 | $34,199 |
Source: Public Records
Map
Nearby Homes
- 1206 Rock Bridge Dr
- 8344 Twin Chapel Dr
- 1058 Cedarbrook Dr
- 1579 Magnolia Way
- 994 Timber Creek Way
- 1442 Grove Park Dr Unit 2
- 1442 Grove Park Dr Unit 8
- 907 Eden St
- 1727 Fountain Ct
- 7841 Edgewater Dr
- 7635 Edgewater Dr
- 7601 Edgewater Dr
- 1438 Grove Park Dr Unit 13B
- 907 Double Churches Rd
- 1719 Double Churches Rd
- 1287 Woodville Ct
- 517 Double Churches Rd
- 7348 Cedar Creek Loop
- 281 Zachary Ct
- 7407 Peppercorn Dr
- 8105 Trafalgar Way
- 1326 Rockbridge Dr
- 1332 Rockbridge Dr
- 1318 Rockbridge Dr
- 8101 Trafalgar Way
- 8154 Twin Chapel Dr
- 8110 Trafalgar Way
- 8116 Trafalgar Way
- 1310 Rockbridge Dr
- 8164 Twin Chapel Dr
- 8146 Twin Chapel Dr
- 8122 Trafalgar Way
- 8104 Trafalgar Way
- 8102 Trafalgar Way
- 8172 Twin Chapel Dr
- 8201 Trafalgar Way
- 8136 Twin Chapel Dr
- 8202 Rockbridge Ct
- 8126 Twin Chapel Dr
- 8137 Bryn Mawr Ln