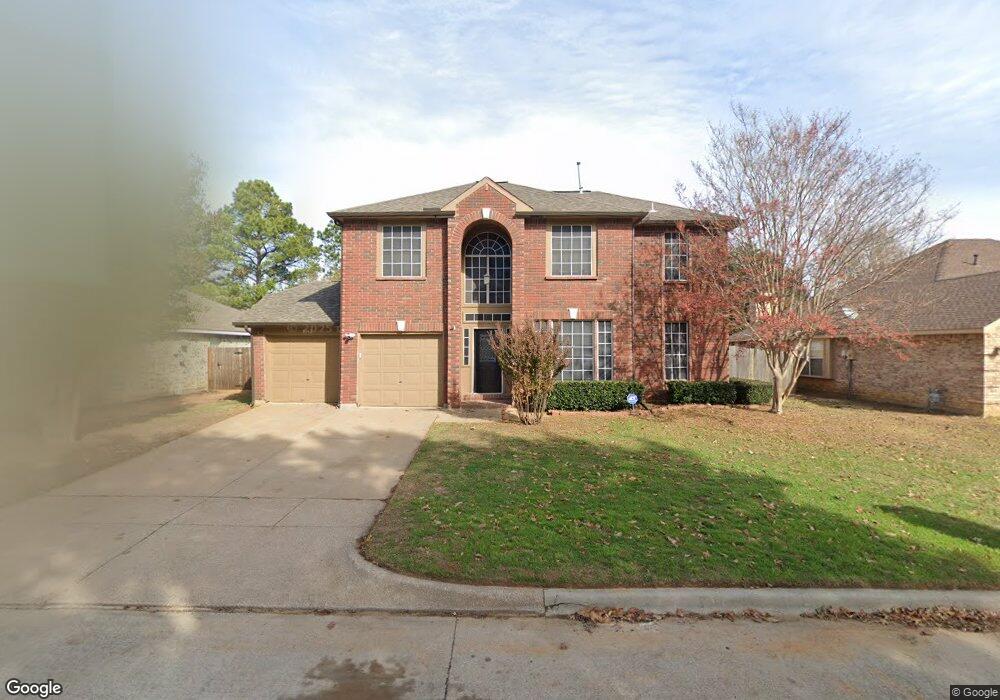
8112 Fireside Dr North Richland Hills, TX 76182
Estimated Value: $394,560 - $452,000
4
Beds
3
Baths
2,113
Sq Ft
$205/Sq Ft
Est. Value
About This Home
This home is located at 8112 Fireside Dr, North Richland Hills, TX 76182 and is currently estimated at $432,390, approximately $204 per square foot. 8112 Fireside Dr is a home located in Tarrant County with nearby schools including Green Valley Elementary School, North Ridge Middle School, and Richland High School.
Ownership History
Date
Name
Owned For
Owner Type
Purchase Details
Closed on
Feb 10, 2009
Sold by
Deutsche Bank National Trust Company
Bought by
Weeraman Sandi and Weeraman Naleen
Current Estimated Value
Home Financials for this Owner
Home Financials are based on the most recent Mortgage that was taken out on this home.
Original Mortgage
$143,256
Outstanding Balance
$89,236
Interest Rate
4.91%
Mortgage Type
FHA
Estimated Equity
$343,154
Purchase Details
Closed on
Dec 7, 2004
Sold by
Smith Marvin D
Bought by
Wright Roy L and Wright Kathy J
Home Financials for this Owner
Home Financials are based on the most recent Mortgage that was taken out on this home.
Original Mortgage
$129,950
Interest Rate
5.76%
Mortgage Type
Fannie Mae Freddie Mac
Purchase Details
Closed on
Oct 15, 1998
Sold by
Hupp Gregory Chester and Hupp Catherine Ruth
Bought by
Smith Marvin D
Home Financials for this Owner
Home Financials are based on the most recent Mortgage that was taken out on this home.
Original Mortgage
$90,000
Interest Rate
6.73%
Create a Home Valuation Report for This Property
The Home Valuation Report is an in-depth analysis detailing your home's value as well as a comparison with similar homes in the area
Home Values in the Area
Average Home Value in this Area
Purchase History
| Date | Buyer | Sale Price | Title Company |
|---|---|---|---|
| Weeraman Sandi | -- | American Title | |
| Wright Roy L | -- | Richmond Title Services Lp | |
| Smith Marvin D | -- | American Title Co |
Source: Public Records
Mortgage History
| Date | Status | Borrower | Loan Amount |
|---|---|---|---|
| Open | Weeraman Sandi | $143,256 | |
| Previous Owner | Wright Roy L | $129,950 | |
| Previous Owner | Smith Marvin D | $90,000 |
Source: Public Records
Tax History Compared to Growth
Tax History
| Year | Tax Paid | Tax Assessment Tax Assessment Total Assessment is a certain percentage of the fair market value that is determined by local assessors to be the total taxable value of land and additions on the property. | Land | Improvement |
|---|---|---|---|---|
| 2025 | $8,224 | $326,660 | $75,000 | $251,660 |
| 2024 | $8,224 | $379,000 | $75,000 | $304,000 |
| 2023 | $8,720 | $397,492 | $75,000 | $322,492 |
| 2022 | $6,855 | $284,856 | $45,000 | $239,856 |
| 2021 | $7,248 | $284,856 | $45,000 | $239,856 |
| 2020 | $6,631 | $260,600 | $45,000 | $215,600 |
| 2019 | $6,863 | $260,600 | $45,000 | $215,600 |
| 2018 | $6,863 | $260,600 | $45,000 | $215,600 |
| 2017 | $6,371 | $236,805 | $45,000 | $191,805 |
| 2016 | $5,462 | $203,000 | $35,000 | $168,000 |
| 2015 | $4,653 | $173,200 | $20,000 | $153,200 |
| 2014 | $4,653 | $173,200 | $20,000 | $153,200 |
Source: Public Records
Map
Nearby Homes
- 7924 Woodland Dr
- 7924 Ember Oaks Dr
- 7901 Forest Point Ct
- 8229 Forest Glenn
- 8048 Green Valley Dr
- 8000 Long Trail Dr
- 8316 Westwind Ln
- 7716 Bridlewood Ct
- 8428 Hidden Creek Ct
- 8324 Flat Rock Ct
- 8133 Pecan Ridge Dr
- 8417 Patricks Path
- 8200 Thornhill Dr
- 8600 Foxwood Dr
- 8308 Johns Way
- 7404 Forrest Ln
- 8381 Davis Blvd Unit 208
- 8420 Grand View Dr
- 7716 Evergreen Ave
- 8436 Parkdale Dr
- 8108 Fireside Dr
- 8116 Fireside Dr
- 8104 Fireside Dr
- 8120 Fireside Dr
- 8109 Fireside Dr
- 8105 Fireside Dr
- 8113 Fireside Dr
- 8100 Fireside Dr
- 8124 Fireside Dr
- 8117 Fireside Dr
- 8101 Fireside Dr
- 8104 Autumn Run Ln
- 8108 Autumn Run Ln
- 8121 Fireside Dr
- 8100 Autumn Run Ln
- 8040 Fireside Dr
- 8128 Fireside Dr
- 8116 Autumn Run Ln
- 7941 Whispering Woods Ln
- 8036 Fireside Dr