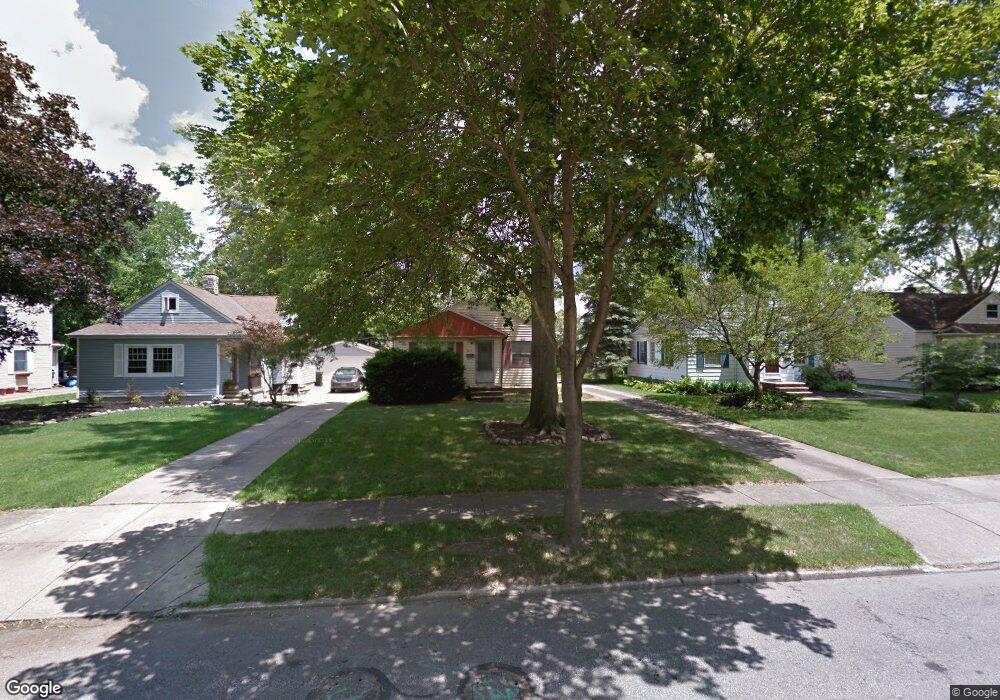
8113 Lynway Ave Olmsted Falls, OH 44138
Estimated Value: $210,000 - $242,000
3
Beds
1
Bath
1,040
Sq Ft
$215/Sq Ft
Est. Value
About This Home
This home is located at 8113 Lynway Ave, Olmsted Falls, OH 44138 and is currently estimated at $223,135, approximately $214 per square foot. 8113 Lynway Ave is a home located in Cuyahoga County with nearby schools including Falls-Lenox Primary Elementary School, Olmsted Falls Intermediate Building, and Olmsted Falls Middle School.
Ownership History
Date
Name
Owned For
Owner Type
Purchase Details
Closed on
Jul 31, 2002
Sold by
Estate Of Timothy G Curry
Bought by
Kociubuk Kathleen and Curry Kevin
Current Estimated Value
Purchase Details
Closed on
May 21, 1992
Sold by
Curry Gloria M
Bought by
Curry Timothy G
Purchase Details
Closed on
Jan 1, 1975
Bought by
Curry Gloria M
Create a Home Valuation Report for This Property
The Home Valuation Report is an in-depth analysis detailing your home's value as well as a comparison with similar homes in the area
Home Values in the Area
Average Home Value in this Area
Purchase History
| Date | Buyer | Sale Price | Title Company |
|---|---|---|---|
| Kociubuk Kathleen | -- | -- | |
| Curry Timothy G | $70,000 | -- | |
| Curry Gloria M | -- | -- |
Source: Public Records
Tax History Compared to Growth
Tax History
| Year | Tax Paid | Tax Assessment Tax Assessment Total Assessment is a certain percentage of the fair market value that is determined by local assessors to be the total taxable value of land and additions on the property. | Land | Improvement |
|---|---|---|---|---|
| 2024 | $4,487 | $66,535 | $12,635 | $53,900 |
| 2023 | $4,007 | $48,520 | $11,730 | $36,790 |
| 2022 | $3,969 | $48,510 | $11,730 | $36,790 |
| 2021 | $3,932 | $48,510 | $11,730 | $36,790 |
| 2020 | $3,560 | $38,820 | $9,380 | $29,440 |
| 2019 | $3,171 | $110,900 | $26,800 | $84,100 |
| 2018 | $3,202 | $38,820 | $9,380 | $29,440 |
| 2017 | $3,216 | $36,480 | $10,050 | $26,430 |
| 2016 | $3,199 | $36,480 | $10,050 | $26,430 |
| 2015 | $3,047 | $36,480 | $10,050 | $26,430 |
| 2014 | $3,047 | $33,780 | $9,310 | $24,470 |
Source: Public Records
Map
Nearby Homes
- V/L Columbia Rd
- 0
- 26535 Bayfair Dr
- 7593 Columbia Rd
- 25725 Cook Rd
- 26685 Cranage Rd
- 281-12-024 River Rd
- 281-12-007 River Rd
- 8241 Lewis Rd
- 29 Carl Ln
- Anderson Plan at Smokestack Trails
- Bramante Ranch Plan at Smokestack Trails
- Hudson Plan at Smokestack Trails
- Columbia Plan at Smokestack Trails
- Lehigh Plan at Smokestack Trails
- 27 Sycamore Dr
- 26788 Skyline Dr
- 11 Concert Ct
- 3 Dogwood Ln
- 42 Periwinkle Dr
- 8125 Lynway Ave
- 8101 Lynway Ave
- 8137 Lynway Ave
- 8091 Lynway Ave
- 8149 Lynway Ave
- 8116 Olmway Ave
- 8100 Olmway Ave
- 8128 Olmway Ave
- 8092 Olmway Ave
- 8112 Lynway Ave
- 8161 Lynway Ave
- 8122 Lynway Ave
- 25961 Garfield Ave
- 8154 Olmway Ave
- 8100 Lynway Ave
- 26001 Garfield Ave
- 8132 Lynway Ave
- 25949 Garfield Ave
- 8088 Lynway Ave
- 8144 Lynway Ave