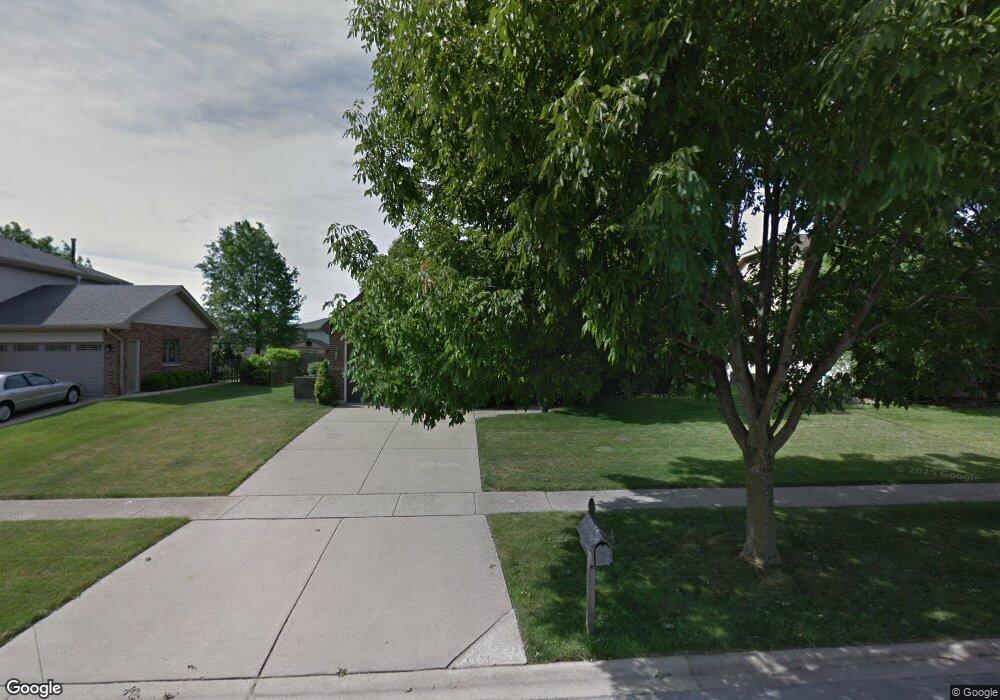
8115 Shoshone Trail Tinley Park, IL 60477
Central Tinley Park NeighborhoodEstimated Value: $405,000 - $466,000
3
Beds
2
Baths
1,958
Sq Ft
$221/Sq Ft
Est. Value
About This Home
This home is located at 8115 Shoshone Trail, Tinley Park, IL 60477 and is currently estimated at $432,578, approximately $220 per square foot. 8115 Shoshone Trail is a home located in Cook County with nearby schools including Millennium Elementary School, Virgil I Grissom Middle School, and Victor J Andrew High School.
Ownership History
Date
Name
Owned For
Owner Type
Purchase Details
Closed on
Jul 31, 2014
Sold by
Fricke Deborah A
Bought by
Fricke James and Fricke Deborah A
Current Estimated Value
Purchase Details
Closed on
Apr 2, 2010
Sold by
Blanusha James J
Bought by
Blanusha Deborah A
Purchase Details
Closed on
Aug 3, 2009
Sold by
Blanusha James J
Bought by
Nee Blanusha James J and Mark Blanusha Supplemental Needs Trust
Create a Home Valuation Report for This Property
The Home Valuation Report is an in-depth analysis detailing your home's value as well as a comparison with similar homes in the area
Home Values in the Area
Average Home Value in this Area
Purchase History
| Date | Buyer | Sale Price | Title Company |
|---|---|---|---|
| Fricke James | -- | None Available | |
| Blanusha Deborah A | -- | None Available | |
| Nee Blanusha James J | -- | None Available |
Source: Public Records
Tax History Compared to Growth
Tax History
| Year | Tax Paid | Tax Assessment Tax Assessment Total Assessment is a certain percentage of the fair market value that is determined by local assessors to be the total taxable value of land and additions on the property. | Land | Improvement |
|---|---|---|---|---|
| 2024 | $8,212 | $35,547 | $6,480 | $29,067 |
| 2023 | $7,317 | $35,547 | $6,480 | $29,067 |
| 2022 | $7,317 | $26,680 | $5,670 | $21,010 |
| 2021 | $7,137 | $26,680 | $5,670 | $21,010 |
| 2020 | $7,924 | $26,680 | $5,670 | $21,010 |
| 2019 | $8,082 | $28,350 | $5,130 | $23,220 |
| 2018 | $7,907 | $28,350 | $5,130 | $23,220 |
| 2017 | $7,715 | $28,350 | $5,130 | $23,220 |
| 2016 | $7,317 | $24,527 | $4,590 | $19,937 |
| 2015 | $7,197 | $24,527 | $4,590 | $19,937 |
| 2014 | $7,153 | $24,527 | $4,590 | $19,937 |
| 2013 | $7,404 | $27,145 | $4,590 | $22,555 |
Source: Public Records
Map
Nearby Homes
- 8036 Blarney Rd
- 7925 Belle Rive Ct
- 8313 Aster Ln
- 7783 Bristol Park Dr Unit 1-SW
- 8030 Valley View Dr
- 7767 Bristol Park Dr Unit 7767
- 7755 Bristol Park Dr Unit 1NE
- 7727 Bristol Park Dr
- 7912 172nd Place
- 8416 Stratford Dr Unit 8416
- 8423 Stratford Dr Unit 8423
- Fremont Plan at Radcliffe Place
- Calysta Plan at Radcliffe Place
- Danbury Plan at Radcliffe Place
- Briarcliffe Plan at Radcliffe Place
- Eden Plan at Radcliffe Place
- Amberwood Plan at Radcliffe Place
- 17631 Dover Ct
- 18261 Kirby Dr Unit 2918261
- 7517 175th St Unit 331
- 8105 Shoshone Trail
- 8125 Shoshone Trail
- 8120 Piute Trail
- 8065 Shoshone Trail
- 8110 Piute Trail
- 8130 Piute Trail
- 17715 Iroquois Trace
- 8060 Piute Trail
- 8110 Shoshone Trail
- 8120 Shoshone Trail
- 8140 Piute Trail
- 8100 Shoshone Trail
- 8055 Shoshone Trail
- 8130 Shoshone Trail
- 8050 Piute Trail
- 8050 Shoshone Trail
- 8045 Shoshone Trail
- 8125 Piute Trail
- 8115 Piute Trail
- 8040 Shoshone Trail