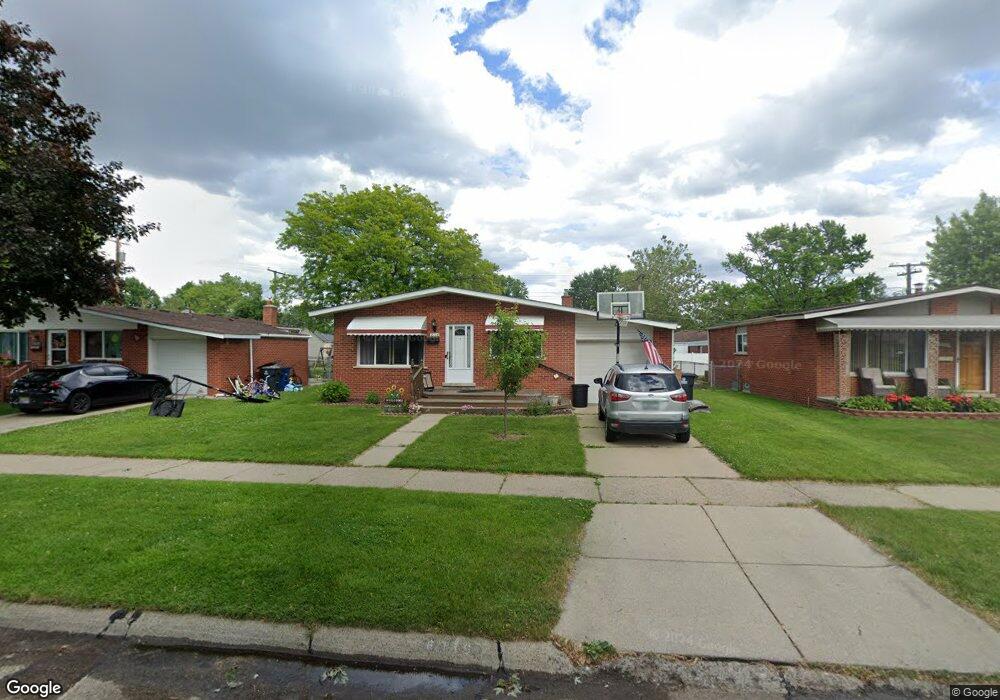
8116 Hillcrest Blvd Unit Bldg-Unit Westland, MI 48185
Estimated Value: $253,000 - $258,006
--
Bed
1
Bath
1,026
Sq Ft
$249/Sq Ft
Est. Value
About This Home
This home is located at 8116 Hillcrest Blvd Unit Bldg-Unit, Westland, MI 48185 and is currently estimated at $255,252, approximately $248 per square foot. 8116 Hillcrest Blvd Unit Bldg-Unit is a home located in Wayne County with nearby schools including Hayes Elementary School, Cooper Upper Elementary School, and Emerson Middle School.
Ownership History
Date
Name
Owned For
Owner Type
Purchase Details
Closed on
Jul 29, 2025
Sold by
Colleen Catherine Shafer Living Trust and Shafer Colleen Catherine
Bought by
Shafer Russell and Shafer Jessica
Current Estimated Value
Home Financials for this Owner
Home Financials are based on the most recent Mortgage that was taken out on this home.
Original Mortgage
$150,151
Outstanding Balance
$149,783
Interest Rate
6.81%
Mortgage Type
VA
Estimated Equity
$105,469
Purchase Details
Closed on
Nov 12, 2022
Sold by
Shafer Colleen
Bought by
Colleen Catherine Shafer Living Trust
Purchase Details
Closed on
Aug 1, 2018
Sold by
Salvato Vincent J and Salvato Michele M
Bought by
Shafer Colleen
Purchase Details
Closed on
Oct 23, 2017
Sold by
Salvato Michele M and The Leona M Pipa Living Trust
Bought by
Salvato Vincent J
Purchase Details
Closed on
Nov 14, 2008
Sold by
Pipa Michael and Pipa Leona M
Bought by
Pipa Michael
Create a Home Valuation Report for This Property
The Home Valuation Report is an in-depth analysis detailing your home's value as well as a comparison with similar homes in the area
Home Values in the Area
Average Home Value in this Area
Purchase History
| Date | Buyer | Sale Price | Title Company |
|---|---|---|---|
| Shafer Russell | $131,417 | Title365 | |
| Colleen Catherine Shafer Living Trust | -- | -- | |
| Shafer Colleen | $155,000 | Fidelity National Ttl Group | |
| Salvato Vincent J | -- | None Available | |
| Pipa Michael | -- | None Available | |
| Pipa Michael | -- | None Available |
Source: Public Records
Mortgage History
| Date | Status | Borrower | Loan Amount |
|---|---|---|---|
| Open | Shafer Russell | $150,151 |
Source: Public Records
Tax History Compared to Growth
Tax History
| Year | Tax Paid | Tax Assessment Tax Assessment Total Assessment is a certain percentage of the fair market value that is determined by local assessors to be the total taxable value of land and additions on the property. | Land | Improvement |
|---|---|---|---|---|
| 2025 | $3,674 | $117,300 | $0 | $0 |
| 2024 | $3,674 | $107,800 | $0 | $0 |
| 2023 | $3,508 | $94,000 | $0 | $0 |
| 2022 | $3,414 | $74,300 | $0 | $0 |
| 2021 | $3,328 | $70,900 | $0 | $0 |
| 2020 | $3,294 | $67,300 | $0 | $0 |
| 2019 | $3,138 | $65,200 | $0 | $0 |
| 2018 | $1,910 | $54,800 | $0 | $0 |
| 2017 | $656 | $51,000 | $0 | $0 |
| 2016 | $1,845 | $51,300 | $0 | $0 |
| 2015 | $3,803 | $47,800 | $0 | $0 |
| 2013 | $3,684 | $37,630 | $0 | $0 |
| 2012 | $1,731 | $38,320 | $0 | $0 |
Source: Public Records
Map
Nearby Homes
- 30604 Ann Arbor Trail
- 30614 Ann Arbor Trail
- 8346 Hillcrest Blvd
- 8148 Randy Dr
- 7841 Randy Dr
- 8157 Gary Ave
- 7715 Donna St
- 7721 Carrousel Blvd
- 8226 Huntington St Unit 24
- 8226 Huntington St Unit 25
- 7637 Melvin Ave
- 8037 Beatrice
- 7505 Donna St
- 8309 Hugh St
- 8483 Beatrice
- 30627 Joy Rd
- 8411 Hugh St
- 8618 Beatrice
- 31273 Mackenzie Dr
- 29639 Shacket St
- 8116 Hillcrest Blvd
- 8108 Hillcrest Blvd
- 8109 N Henry Ruff Rd
- 8119 N Henry Ruff Rd
- 8128 Hillcrest Blvd
- 8129 N Henry Ruff Rd
- 30427 Lonnie Blvd
- 30417 Lonnie Blvd
- 30437 Lonnie Blvd
- 8138 Hillcrest Blvd
- 8109 Hillcrest Blvd
- 8139 N Henry Ruff Rd
- 8117 Hillcrest Blvd
- 30407 Lonnie Blvd
- 30501 Lonnie Blvd
- 8148 Hillcrest Blvd
- 8127 Hillcrest Blvd
- 8149 N Henry Ruff Rd
- 30511 Lonnie Blvd
- 8110 N Henry Ruff Rd