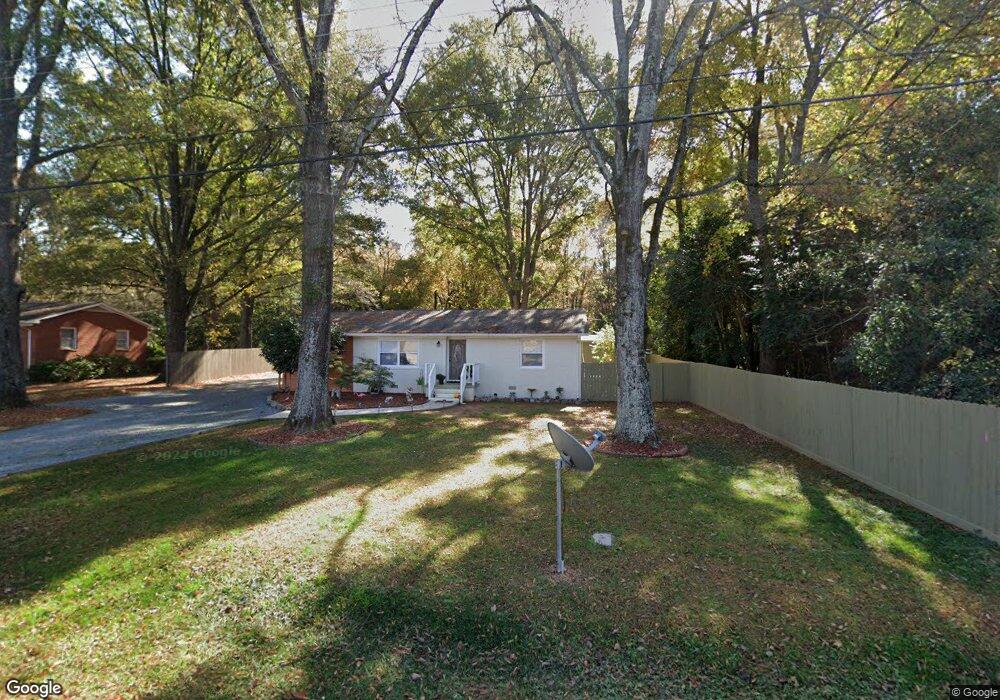
8116 Pine Hill Rd Mint Hill, NC 28227
Estimated Value: $279,083 - $298,000
3
Beds
1
Bath
1,222
Sq Ft
$236/Sq Ft
Est. Value
About This Home
This home is located at 8116 Pine Hill Rd, Mint Hill, NC 28227 and is currently estimated at $288,021, approximately $235 per square foot. 8116 Pine Hill Rd is a home located in Mecklenburg County with nearby schools including Bain Elementary, Mint Hill Middle School, and Independence High.
Ownership History
Date
Name
Owned For
Owner Type
Purchase Details
Closed on
Jan 10, 2017
Sold by
Us Bank Trust National Association
Bought by
Subl Mse
Current Estimated Value
Purchase Details
Closed on
Jan 9, 2017
Sold by
Arm Trs Llc
Bought by
Us Bank Trust National Association and Arwl 2014 1 Trust
Purchase Details
Closed on
Aug 18, 2015
Sold by
Hs Property Owner Llc
Bought by
Arwl 2014 1 Trust
Purchase Details
Closed on
Aug 27, 2014
Sold by
Regions Banks
Bought by
Hs Property Owner Llc
Purchase Details
Closed on
Apr 1, 2014
Sold by
Evankovech Tina J and Calci Ernest J
Bought by
Regions Bank
Purchase Details
Closed on
Mar 29, 2000
Sold by
Hollar Clifford T and Hollar Deborah
Bought by
Calaci Ernest J and Evankovech Tina J
Home Financials for this Owner
Home Financials are based on the most recent Mortgage that was taken out on this home.
Original Mortgage
$85,000
Interest Rate
8.38%
Mortgage Type
Balloon
Create a Home Valuation Report for This Property
The Home Valuation Report is an in-depth analysis detailing your home's value as well as a comparison with similar homes in the area
Home Values in the Area
Average Home Value in this Area
Purchase History
| Date | Buyer | Sale Price | Title Company |
|---|---|---|---|
| Subl Mse | $46,500 | None Available | |
| Us Bank Trust National Association | -- | None Available | |
| Arwl 2014 1 Trust | $103,000 | Attorney | |
| Hs Property Owner Llc | $66,000 | None Available | |
| Regions Bank | $50,000 | None Available | |
| Calaci Ernest J | $85,000 | -- |
Source: Public Records
Mortgage History
| Date | Status | Borrower | Loan Amount |
|---|---|---|---|
| Previous Owner | Calaci Ernest J | $85,000 |
Source: Public Records
Tax History
| Year | Tax Paid | Tax Assessment Tax Assessment Total Assessment is a certain percentage of the fair market value that is determined by local assessors to be the total taxable value of land and additions on the property. | Land | Improvement |
|---|---|---|---|---|
| 2025 | $1,625 | $222,500 | $59,700 | $162,800 |
| 2024 | $1,625 | $222,500 | $59,700 | $162,800 |
| 2023 | $1,598 | $222,500 | $59,700 | $162,800 |
| 2022 | $1,297 | $144,200 | $32,600 | $111,600 |
| 2021 | $1,297 | $144,200 | $32,600 | $111,600 |
| 2020 | $1,297 | $144,200 | $32,600 | $111,600 |
| 2019 | $1,291 | $144,200 | $32,600 | $111,600 |
| 2018 | $1,082 | $95,100 | $22,600 | $72,500 |
| 2017 | $1,057 | $95,100 | $22,600 | $72,500 |
| 2016 | $1,053 | $95,100 | $22,600 | $72,500 |
| 2015 | $1,050 | $95,100 | $22,600 | $72,500 |
| 2014 | $1,101 | $100,000 | $22,600 | $77,400 |
Source: Public Records
Map
Nearby Homes
- 5024 Hillshire Ln
- 5010 Kinsbridge Dr
- 5108 Kinsbridge Dr
- 5244 Kinsbridge Dr
- 4317 Wilgrove Mint Hill Rd
- 4309 Wilgrove Mint Hill Rd
- 7701 Matthews-Mint Hill Rd
- 8024 Fairview Rd
- 1221 Colgher St
- 8941 Blair Rd
- 3801 Cherrybrook Dr
- 10711 Reid Alexander Ln
- 3523 Marchers Trace Dr
- 7350 Purple Martin Way
- 7342 Purple Martin Way
- 8809 Fairview Rd
- 6815 Cinnamon Cir Unit 6C
- 8530 Olde Stonegate Ln
- 3606 Marchers Trace Dr
- 10830 Kempton Square N
- 8124 Pine Hill Rd
- 8132 Pine Hill Rd
- 8117 Pine Hill Rd
- 8105 Pine Hill Rd
- 8129 Pine Hill Rd
- 4700 Hodge Ln
- 8200 Pine Hill Rd
- 8141 Pine Hill Rd
- 4818 Wilgrove Mint Hill Rd
- 8123 Pine Hill Rd
- 8206 Pine Hill Rd
- 8209 Pine Hill Rd
- 4739 Wilgrove Mint Hill Rd
- 4717 Wilgrove Mint Hill Rd
- 8212 Pine Hill Rd
- 4830 Wilgrove Mint Hill Rd
- 4635 Wilgrove Mint Hill Rd
- 8219 Pine Hill Rd
- 6009 Anglin Place
- 6013 Anglin Place
Your Personal Tour Guide
Ask me questions while you tour the home.