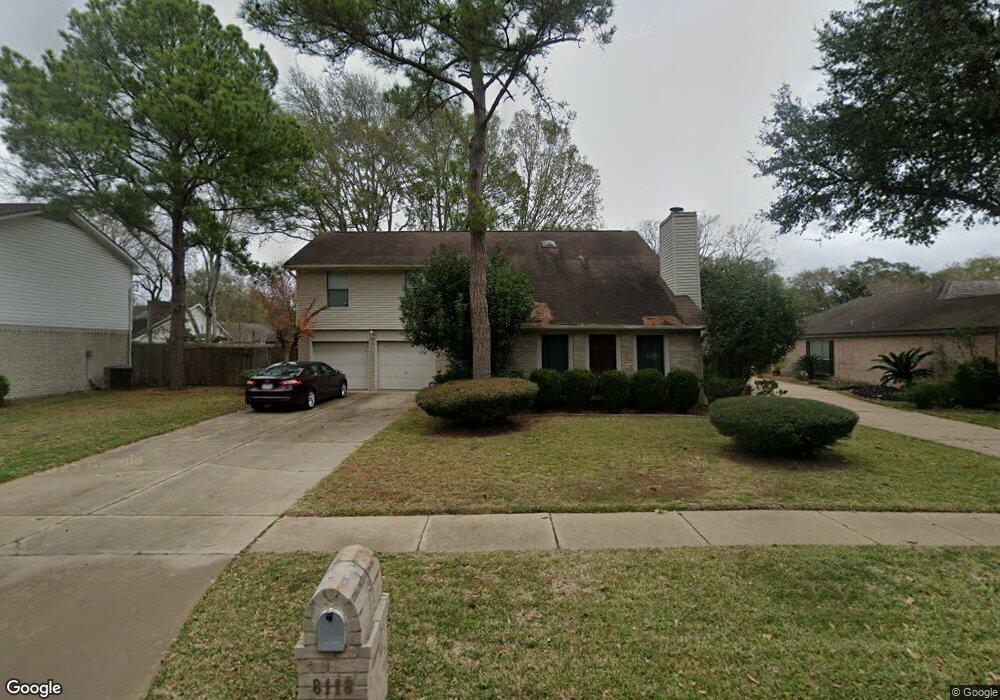
8118 Silent Cedars Dr Houston, TX 77095
Copperfield NeighborhoodEstimated Value: $301,066 - $309,000
4
Beds
3
Baths
2,091
Sq Ft
$145/Sq Ft
Est. Value
About This Home
This home is located at 8118 Silent Cedars Dr, Houston, TX 77095 and is currently estimated at $303,517, approximately $145 per square foot. 8118 Silent Cedars Dr is a home located in Harris County with nearby schools including Fiest Elementary School, Labay Middle School, and Cypress Falls High School.
Ownership History
Date
Name
Owned For
Owner Type
Purchase Details
Closed on
Dec 28, 2016
Sold by
Closson Sean and Closson Geri
Bought by
Mavis Tony and Martinez Alvaro
Current Estimated Value
Home Financials for this Owner
Home Financials are based on the most recent Mortgage that was taken out on this home.
Original Mortgage
$187,540
Outstanding Balance
$152,891
Interest Rate
3.75%
Mortgage Type
FHA
Estimated Equity
$150,626
Purchase Details
Closed on
Apr 26, 2006
Sold by
Richie Mark C and Richie Kelly J
Bought by
Closson Sean
Home Financials for this Owner
Home Financials are based on the most recent Mortgage that was taken out on this home.
Original Mortgage
$121,391
Interest Rate
8.17%
Mortgage Type
Fannie Mae Freddie Mac
Purchase Details
Closed on
Aug 27, 1998
Sold by
Thomas Joe Burke and Thomas Gina Jones
Bought by
Richie Mark C and Richie Kelly J
Home Financials for this Owner
Home Financials are based on the most recent Mortgage that was taken out on this home.
Original Mortgage
$104,500
Interest Rate
6.9%
Create a Home Valuation Report for This Property
The Home Valuation Report is an in-depth analysis detailing your home's value as well as a comparison with similar homes in the area
Home Values in the Area
Average Home Value in this Area
Purchase History
| Date | Buyer | Sale Price | Title Company |
|---|---|---|---|
| Mavis Tony | -- | Frontier Title Co | |
| Closson Sean | -- | Chicago Title Insurance Co | |
| Richie Mark C | -- | Alamo Title |
Source: Public Records
Mortgage History
| Date | Status | Borrower | Loan Amount |
|---|---|---|---|
| Open | Mavis Tony | $187,540 | |
| Previous Owner | Closson Sean | $121,391 | |
| Previous Owner | Richie Mark C | $104,500 |
Source: Public Records
Tax History Compared to Growth
Tax History
| Year | Tax Paid | Tax Assessment Tax Assessment Total Assessment is a certain percentage of the fair market value that is determined by local assessors to be the total taxable value of land and additions on the property. | Land | Improvement |
|---|---|---|---|---|
| 2025 | $4,034 | $282,244 | $76,104 | $206,140 |
| 2024 | $4,034 | $270,901 | $76,104 | $194,797 |
| 2023 | $4,034 | $303,166 | $76,104 | $227,062 |
| 2022 | $5,423 | $250,266 | $54,360 | $195,906 |
| 2021 | $5,204 | $198,848 | $54,360 | $144,488 |
| 2020 | $5,220 | $192,827 | $45,300 | $147,527 |
| 2019 | $5,102 | $182,992 | $27,180 | $155,812 |
| 2018 | $1,645 | $174,004 | $27,180 | $146,824 |
| 2017 | $4,852 | $174,004 | $27,180 | $146,824 |
| 2016 | $4,672 | $174,004 | $27,180 | $146,824 |
| 2015 | $3,150 | $153,420 | $27,180 | $126,240 |
| 2014 | $3,150 | $138,452 | $27,180 | $111,272 |
Source: Public Records
Map
Nearby Homes
- 8211 Riverglade Dr
- 15339 Glenwood Park Dr
- 15131 New Hastings Dr
- 8203 Green Devon Dr
- 15010 Chetland Place Dr
- 14962 Royal Birkdale St
- 15611 Meadow Village Dr
- 7731 Club Lake Dr
- 14919 Forest Trails Dr
- 14931 Inverrary Dr
- 15854 Knolls Lodge Dr
- 7827 Alamar Dr
- 15918 Pinyon Creek Dr
- 15415 Swan Creek Dr
- 15362 Meadow Village Dr
- 15414 Swan Creek Dr
- 14911 Sandalfoot St
- 8526 Hot Springs Dr
- 8526 Greenleaf Lake Dr
- 15810 Knoll Lake Dr
- 8122 Silent Cedars Dr
- 8114 Silent Cedars Dr
- 15403 Quiet Creek Dr
- 15315 Quiet Creek Dr
- 15407 Quiet Creek Dr
- 8126 Silent Cedars Dr
- 8110 Silent Cedars Dr
- 15311 Quiet Creek Dr
- 8119 Silent Cedars Dr
- 8123 Silent Cedars Dr
- 8115 Silent Cedars Dr
- 15307 Quiet Creek Dr
- 8106 Silent Cedars Dr
- 8111 Silent Cedars Dr
- 15411 Quiet Creek Dr
- 15303 Quiet Creek Dr
- 8106 Tall Firs Ln
- 8134 Silent Cedars Dr
- 15402 Quiet Creek Dr
- 15314 Quiet Creek Dr