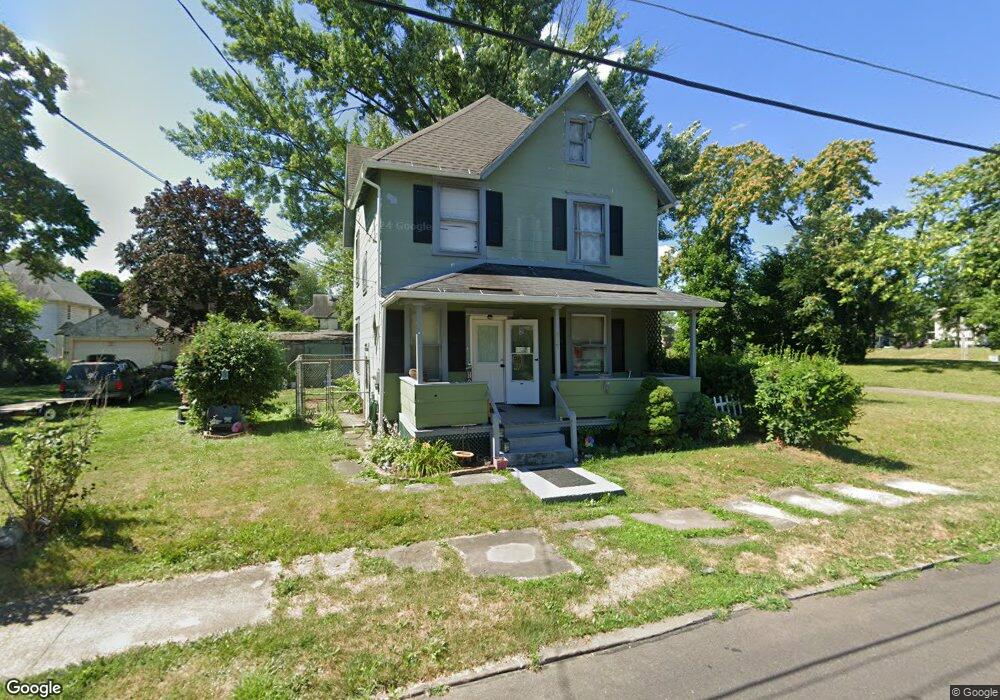
812 10th St NW Canton, OH 44703
Summit NeighborhoodEstimated Value: $72,000 - $88,000
3
Beds
1
Bath
1,344
Sq Ft
$58/Sq Ft
Est. Value
About This Home
This home is located at 812 10th St NW, Canton, OH 44703 and is currently estimated at $78,282, approximately $58 per square foot. 812 10th St NW is a home located in Stark County with nearby schools including Early Learning Center @ Schreiber, Gibbs Elementary School, and Clarendon Intermediate School.
Ownership History
Date
Name
Owned For
Owner Type
Purchase Details
Closed on
Apr 11, 2002
Sold by
Property Enhancements Inc
Bought by
Anthony Ernie
Current Estimated Value
Home Financials for this Owner
Home Financials are based on the most recent Mortgage that was taken out on this home.
Original Mortgage
$33,200
Outstanding Balance
$13,773
Interest Rate
6.82%
Mortgage Type
Purchase Money Mortgage
Estimated Equity
$64,509
Purchase Details
Closed on
Jan 16, 2001
Sold by
Wmc Mtg Corp
Bought by
Property Enhancements Inc
Purchase Details
Closed on
Sep 11, 2000
Sold by
Ross Timothy E
Bought by
Wmc Mtg Corp
Purchase Details
Closed on
Jul 19, 2000
Sold by
Ross Timothy E and Ross Jane
Bought by
Wmc Mtg Corp
Purchase Details
Closed on
Mar 27, 1998
Sold by
Zickefoose E D
Bought by
Ross Timothy E
Home Financials for this Owner
Home Financials are based on the most recent Mortgage that was taken out on this home.
Original Mortgage
$40,600
Interest Rate
10.75%
Mortgage Type
New Conventional
Create a Home Valuation Report for This Property
The Home Valuation Report is an in-depth analysis detailing your home's value as well as a comparison with similar homes in the area
Home Values in the Area
Average Home Value in this Area
Purchase History
| Date | Buyer | Sale Price | Title Company |
|---|---|---|---|
| Anthony Ernie | $35,000 | Cresent Title Agency | |
| Property Enhancements Inc | $13,800 | -- | |
| Wmc Mtg Corp | $22,000 | -- | |
| Wmc Mtg Corp | $22,000 | -- | |
| Ross Timothy E | $35,000 | -- |
Source: Public Records
Mortgage History
| Date | Status | Borrower | Loan Amount |
|---|---|---|---|
| Open | Anthony Ernie | $33,200 | |
| Previous Owner | Ross Timothy E | $40,600 |
Source: Public Records
Tax History Compared to Growth
Tax History
| Year | Tax Paid | Tax Assessment Tax Assessment Total Assessment is a certain percentage of the fair market value that is determined by local assessors to be the total taxable value of land and additions on the property. | Land | Improvement |
|---|---|---|---|---|
| 2025 | -- | $18,210 | $3,330 | $14,880 |
| 2024 | -- | $18,210 | $3,330 | $14,880 |
| 2023 | $594 | $9,600 | $2,000 | $7,600 |
| 2022 | $574 | $9,600 | $2,000 | $7,600 |
| 2021 | $580 | $9,600 | $2,000 | $7,600 |
| 2020 | $606 | $9,000 | $1,930 | $7,070 |
| 2019 | $532 | $9,000 | $1,930 | $7,070 |
| 2018 | $535 | $9,000 | $1,930 | $7,070 |
| 2017 | $608 | $9,320 | $2,140 | $7,180 |
| 2016 | $583 | $8,900 | $2,140 | $6,760 |
| 2015 | $586 | $8,900 | $2,140 | $6,760 |
| 2014 | $750 | $10,720 | $2,560 | $8,160 |
| 2013 | $362 | $10,720 | $2,560 | $8,160 |
Source: Public Records
Map
Nearby Homes
- 811 Troy Place NW
- 806 Troy Place NW
- 905 High Ave NW
- 824 12th St NW
- 1005 Dewalt Ave NW
- 1007 Dewalt Ave NW
- 1227 Worley Ave NW
- 722 High Ave NW
- 1231 Worley Ave NW
- 1224 Cleveland Ave NW
- 1023 Fulton Rd NW
- 916 6th St NW
- 1221 9th St NW
- 1306 12th St NW
- 1347 Shorb Ave NW
- 1226 Logan Ave NW
- 1015 4th St NW
- 413 Newton Ave NW
- 1405 8th St NW
- 1024 3rd St NW
- 806 10th St NW
- 816 10th St NW
- 800 10th St NW
- 820 10th St NW
- 815 Troy Place NW
- 825 Troy Place NW
- 823 Troy Place NW
- 718 10th St NW
- 805 10th St NW
- 811 10th St NW
- 936 Shorb Ave NW
- 829 Troy Place NW
- 819 10th St NW
- 942 Shorb Ave NW
- 801 10th St NW
- 714 10th St NW
- 821 10th St NW
- 934 Shorb Ave NW
- 719 10th St NW
- 801 Troy Place NW