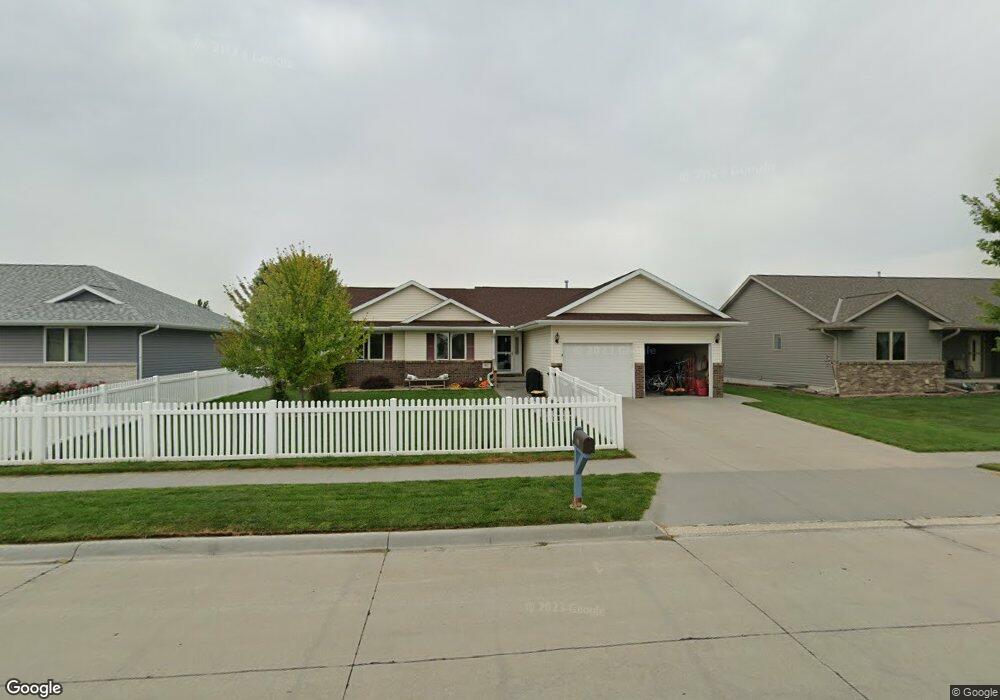
812 11th Ave Kearney, NE 68845
Estimated Value: $365,000 - $431,000
Studio
1
Bath
1,462
Sq Ft
$275/Sq Ft
Est. Value
About This Home
This home is located at 812 11th Ave, Kearney, NE 68845 and is currently estimated at $401,887, approximately $274 per square foot. 812 11th Ave is a home located in Buffalo County with nearby schools including Kenwood Elementary School, Horizon Middle School, and Kearney Senior High School.
Ownership History
Date
Name
Owned For
Owner Type
Purchase Details
Closed on
Oct 13, 2018
Sold by
Bamesberger Matthew H and Bamesberger Barbara J
Bought by
Morris Cory L and Morris Rabecca A
Current Estimated Value
Home Financials for this Owner
Home Financials are based on the most recent Mortgage that was taken out on this home.
Original Mortgage
$242,155
Outstanding Balance
$209,892
Interest Rate
4.6%
Mortgage Type
New Conventional
Estimated Equity
$191,995
Purchase Details
Closed on
Mar 14, 2008
Sold by
Moore Construction Inc
Bought by
Bamesberger Matthew H and Bamesberger Barbara J
Create a Home Valuation Report for This Property
The Home Valuation Report is an in-depth analysis detailing your home's value as well as a comparison with similar homes in the area
Home Values in the Area
Average Home Value in this Area
Purchase History
| Date | Buyer | Sale Price | Title Company |
|---|---|---|---|
| Morris Cory L | $254,900 | Vintage Title | |
| Bamesberger Matthew H | -- | Barney |
Source: Public Records
Mortgage History
| Date | Status | Borrower | Loan Amount |
|---|---|---|---|
| Open | Morris Cory L | $242,155 |
Source: Public Records
Tax History
| Year | Tax Paid | Tax Assessment Tax Assessment Total Assessment is a certain percentage of the fair market value that is determined by local assessors to be the total taxable value of land and additions on the property. | Land | Improvement |
|---|---|---|---|---|
| 2025 | $4,457 | $346,885 | $45,175 | $301,710 |
| 2024 | $5,338 | $335,515 | $43,860 | $291,655 |
| 2023 | $5,338 | $313,665 | $43,860 | $269,805 |
| 2022 | $4,877 | $277,885 | $41,000 | $236,885 |
| 2021 | $4,499 | $260,865 | $35,325 | $225,540 |
| 2020 | $4,496 | $259,945 | $35,325 | $224,620 |
| 2019 | $4,259 | $243,265 | $35,325 | $207,940 |
| 2018 | $4,574 | $265,010 | $35,325 | $229,685 |
| 2017 | $4,118 | $240,150 | $35,325 | $204,825 |
| 2016 | $3,882 | $228,280 | $35,325 | $192,955 |
| 2015 | $3,794 | $218,120 | $0 | $0 |
| 2014 | $3,939 | $206,590 | $0 | $0 |
Source: Public Records
Map
Nearby Homes
Your Personal Tour Guide
Ask me questions while you tour the home.