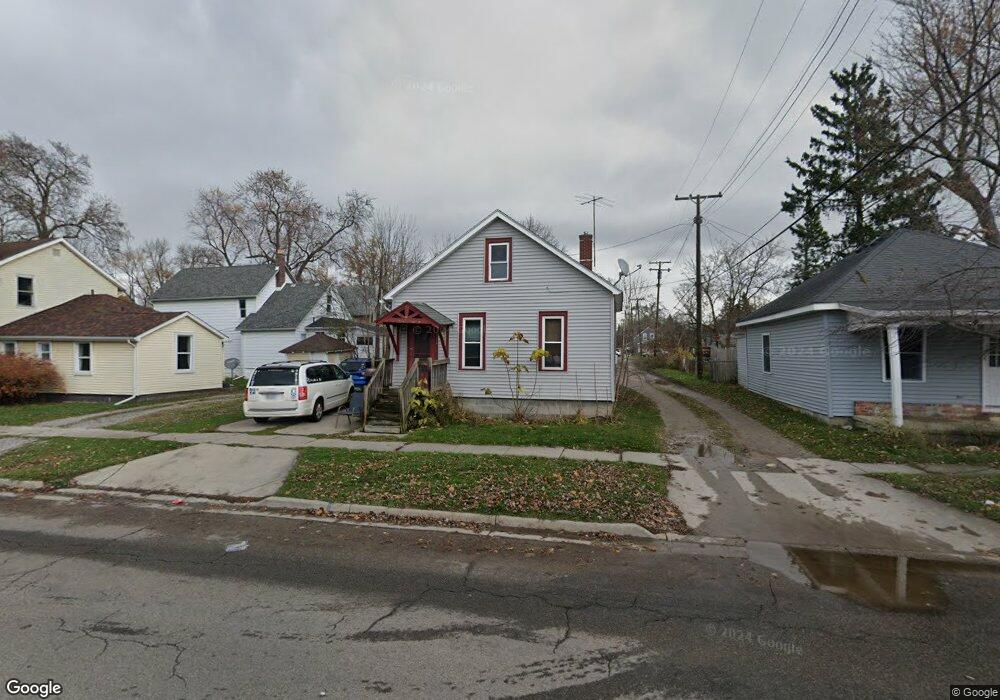
812 13th St Port Huron, MI 48060
Estimated Value: $86,000 - $108,000
2
Beds
1
Bath
814
Sq Ft
$116/Sq Ft
Est. Value
About This Home
This home is located at 812 13th St, Port Huron, MI 48060 and is currently estimated at $94,781, approximately $116 per square foot. 812 13th St is a home located in St. Clair County with nearby schools including Woodrow Wilson Elementary School, Central Middle School, and Port Huron High School.
Ownership History
Date
Name
Owned For
Owner Type
Purchase Details
Closed on
Mar 12, 2015
Sold by
Armstrong Lawrence and Armstrong Susan
Bought by
George Frederick W
Current Estimated Value
Purchase Details
Closed on
Dec 4, 2007
Sold by
Us Bank National Association
Bought by
Armstrong Lawrence and Armstrong Susan
Purchase Details
Closed on
Jan 25, 2007
Sold by
Senyk Nicholas M
Bought by
Us Bank Mational Association
Create a Home Valuation Report for This Property
The Home Valuation Report is an in-depth analysis detailing your home's value as well as a comparison with similar homes in the area
Home Values in the Area
Average Home Value in this Area
Purchase History
| Date | Buyer | Sale Price | Title Company |
|---|---|---|---|
| George Frederick W | $15,000 | None Available | |
| Armstrong Lawrence | $20,000 | Prism Title & Closing Servic | |
| Us Bank Mational Association | $54,500 | None Available |
Source: Public Records
Tax History Compared to Growth
Tax History
| Year | Tax Paid | Tax Assessment Tax Assessment Total Assessment is a certain percentage of the fair market value that is determined by local assessors to be the total taxable value of land and additions on the property. | Land | Improvement |
|---|---|---|---|---|
| 2025 | $1,196 | $39,200 | $0 | $0 |
| 2024 | $860 | $37,900 | $0 | $0 |
| 2023 | $813 | $33,600 | $0 | $0 |
| 2022 | $779 | $27,700 | $0 | $0 |
| 2021 | $740 | $23,600 | $0 | $0 |
| 2020 | $748 | $20,900 | $20,900 | $0 |
| 2019 | $735 | $15,700 | $0 | $0 |
| 2018 | $719 | $15,700 | $0 | $0 |
| 2017 | $644 | $15,000 | $0 | $0 |
| 2016 | $538 | $15,000 | $0 | $0 |
| 2015 | $759 | $14,600 | $14,600 | $0 |
| 2014 | $759 | $14,100 | $14,100 | $0 |
| 2013 | -- | $14,300 | $0 | $0 |
Source: Public Records
Map
Nearby Homes