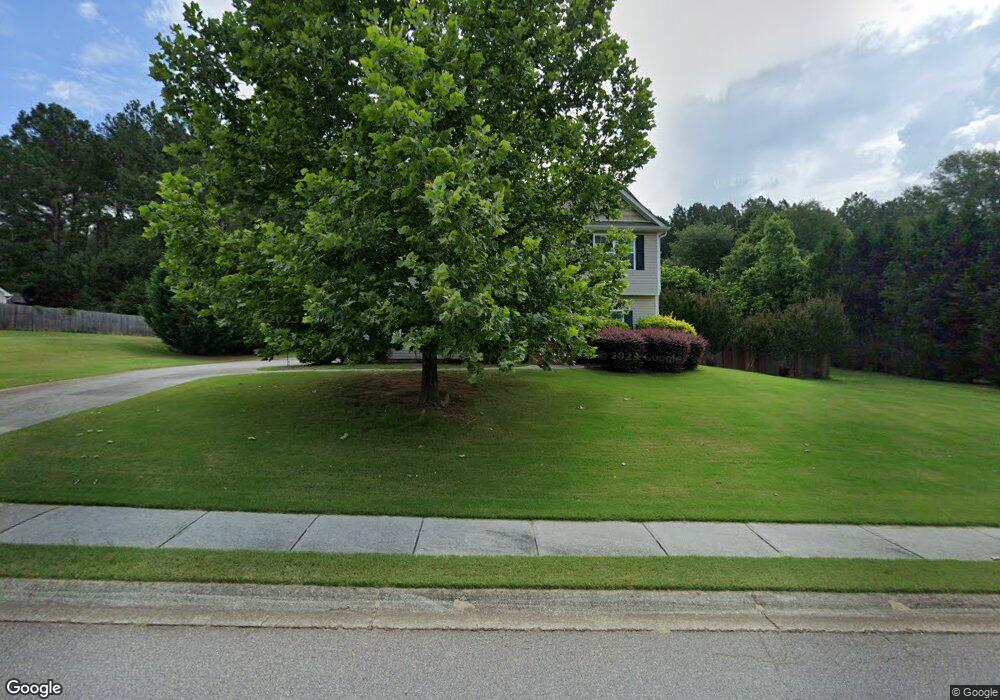
812 Alexis Way Winder, GA 30680
Estimated Value: $329,599 - $359,000
3
Beds
3
Baths
1,657
Sq Ft
$210/Sq Ft
Est. Value
About This Home
This home is located at 812 Alexis Way, Winder, GA 30680 and is currently estimated at $348,650, approximately $210 per square foot. 812 Alexis Way is a home located in Barrow County with nearby schools including Bethlehem Elementary School, Haymon-Morris Middle School, and Apalachee High School.
Ownership History
Date
Name
Owned For
Owner Type
Purchase Details
Closed on
Jan 9, 2013
Sold by
Furguson Michael A
Bought by
Furguson Michael A and Furguson Linda G
Current Estimated Value
Home Financials for this Owner
Home Financials are based on the most recent Mortgage that was taken out on this home.
Original Mortgage
$150,000
Outstanding Balance
$104,247
Interest Rate
3.36%
Mortgage Type
New Conventional
Estimated Equity
$244,403
Purchase Details
Closed on
Nov 12, 2009
Sold by
Detail Homes Inc
Bought by
Furgerson Michael A
Home Financials for this Owner
Home Financials are based on the most recent Mortgage that was taken out on this home.
Original Mortgage
$149,489
Interest Rate
4.92%
Mortgage Type
New Conventional
Purchase Details
Closed on
Apr 29, 2008
Sold by
Rock Hammer Llc
Bought by
Detail Hms Inc
Home Financials for this Owner
Home Financials are based on the most recent Mortgage that was taken out on this home.
Original Mortgage
$125,000
Interest Rate
5.84%
Purchase Details
Closed on
Jul 21, 2006
Sold by
Jackson Julia Claric
Bought by
Rock Hammer Llc
Create a Home Valuation Report for This Property
The Home Valuation Report is an in-depth analysis detailing your home's value as well as a comparison with similar homes in the area
Home Values in the Area
Average Home Value in this Area
Purchase History
| Date | Buyer | Sale Price | Title Company |
|---|---|---|---|
| Furguson Michael A | $150,000 | -- | |
| Furgerson Michael A | $146,500 | -- | |
| Detail Hms Inc | $45,000 | -- | |
| Rock Hammer Llc | -- | -- |
Source: Public Records
Mortgage History
| Date | Status | Borrower | Loan Amount |
|---|---|---|---|
| Open | Furguson Michael A | $150,000 | |
| Previous Owner | Furgerson Michael A | $149,489 | |
| Previous Owner | Detail Hms Inc | $125,000 |
Source: Public Records
Tax History Compared to Growth
Tax History
| Year | Tax Paid | Tax Assessment Tax Assessment Total Assessment is a certain percentage of the fair market value that is determined by local assessors to be the total taxable value of land and additions on the property. | Land | Improvement |
|---|---|---|---|---|
| 2024 | $2,661 | $108,267 | $28,400 | $79,867 |
| 2023 | $2,016 | $98,450 | $28,400 | $70,050 |
| 2022 | $2,437 | $86,110 | $22,400 | $63,710 |
| 2021 | $2,378 | $79,710 | $16,000 | $63,710 |
| 2020 | $1,860 | $62,300 | $16,000 | $46,300 |
| 2019 | $1,891 | $62,300 | $16,000 | $46,300 |
| 2018 | $1,743 | $58,524 | $14,400 | $44,124 |
| 2017 | $1,523 | $52,312 | $14,400 | $37,912 |
| 2016 | $1,479 | $50,827 | $14,400 | $36,427 |
| 2015 | $1,498 | $51,208 | $14,400 | $36,808 |
| 2014 | $1,355 | $46,010 | $8,820 | $37,190 |
| 2013 | -- | $43,277 | $8,820 | $34,457 |
Source: Public Records
Map
Nearby Homes
- 808 Alexis Way
- 813 Alexis Way
- 806 Alexis Way Unit 41
- 0 Alexis Way Unit 8599513
- 0 Alexis Way Unit 9044119
- 0 Alexis Way Unit 9075673
- 0 Alexis Way Unit 8853552
- 0 Alexis Way Unit 3210972
- 0 Alexis Way Unit 3263356
- 0 Alexis Way Unit 3284299
- 0 Alexis Way Unit 7024415
- 0 Alexis Way Unit 7068642
- 0 Alexis Way Unit 7112794
- 0 Alexis Way Unit 7133885
- 0 Alexis Way Unit 7171592
- 0 Alexis Way Unit 7188429
- 0 Alexis Way Unit 7188425
- 0 Alexis Way Unit 7210187
- 0 Alexis Way Unit 7287333
- 0 Alexis Way