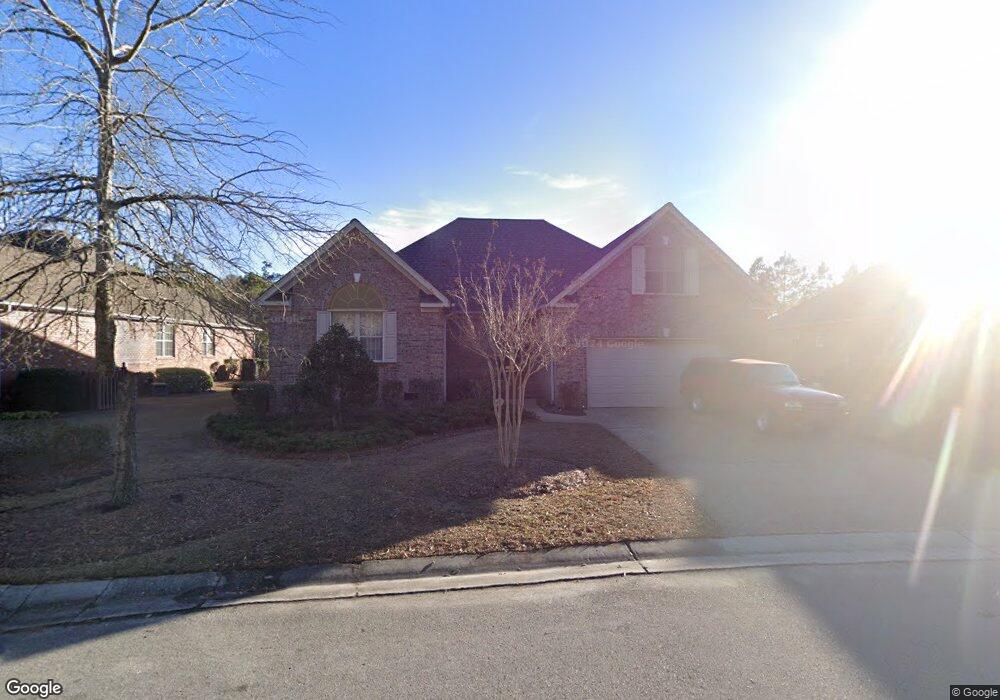
812 Aqua Ln Winnabow, NC 28479
Estimated Value: $433,690 - $485,000
3
Beds
3
Baths
2,300
Sq Ft
$198/Sq Ft
Est. Value
About This Home
This home is located at 812 Aqua Ln, Winnabow, NC 28479 and is currently estimated at $455,423, approximately $198 per square foot. 812 Aqua Ln is a home located in Brunswick County with nearby schools including Belville Elementary School, Leland Middle School, and North Brunswick High School.
Ownership History
Date
Name
Owned For
Owner Type
Purchase Details
Closed on
Feb 24, 2005
Sold by
Premier Homes Of Wilmington Inc
Bought by
Poulos Andrew N and Poulos Debble
Current Estimated Value
Home Financials for this Owner
Home Financials are based on the most recent Mortgage that was taken out on this home.
Original Mortgage
$250,290
Outstanding Balance
$134,959
Interest Rate
5.6%
Mortgage Type
Construction
Estimated Equity
$320,464
Purchase Details
Closed on
Feb 21, 2005
Sold by
Hww Llc
Bought by
Premier Homes Of Wilmington Inc
Home Financials for this Owner
Home Financials are based on the most recent Mortgage that was taken out on this home.
Original Mortgage
$250,290
Outstanding Balance
$134,959
Interest Rate
5.6%
Mortgage Type
Construction
Estimated Equity
$320,464
Create a Home Valuation Report for This Property
The Home Valuation Report is an in-depth analysis detailing your home's value as well as a comparison with similar homes in the area
Home Values in the Area
Average Home Value in this Area
Purchase History
| Date | Buyer | Sale Price | Title Company |
|---|---|---|---|
| Poulos Andrew N | $59,500 | None Available | |
| Premier Homes Of Wilmington Inc | $44,000 | None Available |
Source: Public Records
Mortgage History
| Date | Status | Borrower | Loan Amount |
|---|---|---|---|
| Open | Poulos Andrew N | $250,290 | |
| Closed | Premier Homes Of Wilmington Inc | $250,290 |
Source: Public Records
Tax History Compared to Growth
Tax History
| Year | Tax Paid | Tax Assessment Tax Assessment Total Assessment is a certain percentage of the fair market value that is determined by local assessors to be the total taxable value of land and additions on the property. | Land | Improvement |
|---|---|---|---|---|
| 2025 | -- | $398,990 | $55,000 | $343,990 |
| 2024 | $2,842 | $398,990 | $55,000 | $343,990 |
| 2023 | $2,301 | $398,990 | $55,000 | $343,990 |
| 2022 | $0 | $268,160 | $45,000 | $223,160 |
| 2021 | $1,847 | $268,160 | $45,000 | $223,160 |
| 2020 | $0 | $268,160 | $45,000 | $223,160 |
| 2019 | $2,164 | $46,300 | $45,000 | $1,300 |
| 2018 | $1,963 | $41,570 | $40,000 | $1,570 |
| 2017 | $1,963 | $41,570 | $40,000 | $1,570 |
| 2016 | $1,847 | $41,570 | $40,000 | $1,570 |
| 2015 | $1,769 | $246,520 | $40,000 | $206,520 |
| 2014 | $1,641 | $242,666 | $50,000 | $192,666 |
Source: Public Records
Map
Nearby Homes
- 199 Tylers Cove Way
- 707 Beachwalk Dr
- 745 Beachwalk Dr
- 2197 N Palm Dr
- 207 N Palm Dr
- 195 N Palm Dr
- 136 N Palm Dr
- 796 Beachwalk Dr
- 9898 Black Bear Hollow SE
- 106 Kellerton Ct
- 1105 Avebury Ct
- 1206 Birkdale Dr
- Cypress Plan at Mallory Creek - Townhomes at Mallory Creek
- 130 Jansen Ln
- 134 Jansen Ln
- 368 St Kitts Way
- 511 Heartwood Dr
- 376 St Kitts Way
- 115 Cove Landing
- 123 Cove Landing