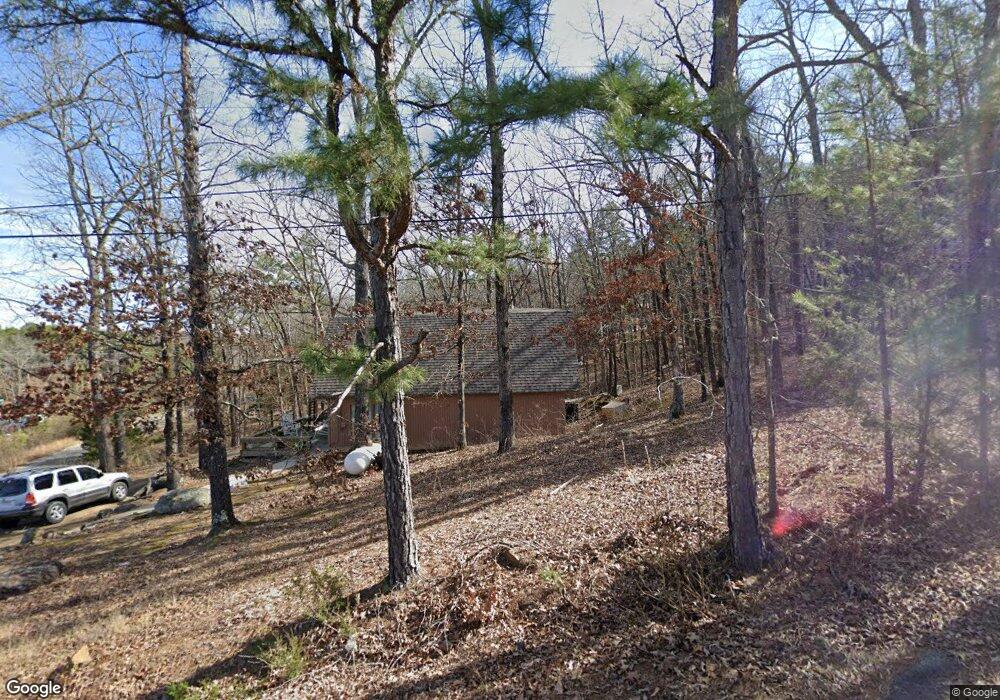
812 Azalea Ln Heber Springs, AR 72543
Estimated Value: $92,000 - $174,000
--
Bed
2
Baths
1,280
Sq Ft
$102/Sq Ft
Est. Value
About This Home
This home is located at 812 Azalea Ln, Heber Springs, AR 72543 and is currently estimated at $130,534, approximately $101 per square foot. 812 Azalea Ln is a home located in Cleburne County with nearby schools including Heber Springs Elementary School, Heber Springs Middle School, and Heber Springs High School.
Ownership History
Date
Name
Owned For
Owner Type
Purchase Details
Closed on
Sep 28, 2018
Sold by
Williford Lowell Edward and Williford Trena L
Bought by
Laster Anthony B and Laster Patricia D
Current Estimated Value
Home Financials for this Owner
Home Financials are based on the most recent Mortgage that was taken out on this home.
Original Mortgage
$40,850
Outstanding Balance
$30,624
Interest Rate
4.5%
Mortgage Type
New Conventional
Estimated Equity
$99,910
Purchase Details
Closed on
Mar 11, 2008
Sold by
Deckard L E
Bought by
Willford Lowell Edward and Willford Trena L
Home Financials for this Owner
Home Financials are based on the most recent Mortgage that was taken out on this home.
Original Mortgage
$34,000
Interest Rate
5.72%
Mortgage Type
New Conventional
Purchase Details
Closed on
Sep 22, 2003
Bought by
Deckard L E
Purchase Details
Closed on
Apr 12, 1991
Bought by
Brock Barbara L
Create a Home Valuation Report for This Property
The Home Valuation Report is an in-depth analysis detailing your home's value as well as a comparison with similar homes in the area
Home Values in the Area
Average Home Value in this Area
Purchase History
| Date | Buyer | Sale Price | Title Company |
|---|---|---|---|
| Laster Anthony B | $43,000 | General Land & Title Service | |
| Willford Lowell Edward | -- | None Available | |
| Deckard L E | $32,100 | -- | |
| Brock Barbara L | $39,500 | -- |
Source: Public Records
Mortgage History
| Date | Status | Borrower | Loan Amount |
|---|---|---|---|
| Open | Laster Anthony B | $40,850 | |
| Previous Owner | Willford Lowell Edward | $34,000 |
Source: Public Records
Tax History Compared to Growth
Tax History
| Year | Tax Paid | Tax Assessment Tax Assessment Total Assessment is a certain percentage of the fair market value that is determined by local assessors to be the total taxable value of land and additions on the property. | Land | Improvement |
|---|---|---|---|---|
| 2024 | $157 | $17,738 | $1,200 | $16,538 |
| 2023 | $686 | $17,738 | $1,200 | $16,538 |
| 2022 | $629 | $17,738 | $1,200 | $16,538 |
| 2021 | $571 | $13,288 | $1,200 | $12,088 |
| 2020 | $571 | $13,288 | $1,200 | $12,088 |
| 2019 | $571 | $13,288 | $1,200 | $12,088 |
| 2018 | $219 | $13,288 | $1,200 | $12,088 |
| 2017 | $212 | $13,288 | $1,200 | $12,088 |
| 2016 | $192 | $12,802 | $900 | $11,902 |
| 2015 | $192 | $12,802 | $900 | $11,902 |
| 2014 | -- | $12,802 | $900 | $11,902 |
Source: Public Records
Map
Nearby Homes
- L29 Dogwood Trail
- 872 Dogwood Trail
- 201 E Main St
- 0 SE Daniel's Cove Unit 25030134
- 0 SE Daniel's Cove Unit 25-451
- 00 Primrose Creek
- 0 Hwy 110 E Unit 25012742
- TBD Turkey Springs Ranch Ln
- 999 15 St
- 000 Wilburn Rd
- 429 E Moore St
- 104 W Spring St
- 105 W Clinton St
- 5500 Wilburn Rd
- 000
- Lot 9 Wisdom Pointe Subdivision
- Lot 1 Wisdom Pointe Subdivision
- 306 S 4th St
- 610 N 2nd St
- 000 Arkansas 25 Bypass
- 813 Azalea Ln
- 806 Azalea Ln
- 819 Dogwood Trail
- 0 Azalea Ln
- 819 Azalea Ln
- 831 Dogwood Trail
- 801 Dogwood Trail
- 1005 S 7th St
- L5 Huckleberry Trail
- 830 Azalea Ln
- 824 Dogwood Trail
- 830 Dogwood Trail
- 806 Dogwood Trail
- 849 Dogwood Trail
- 0 Dogwood Trail Unit 23033166
- 0 Dogwood Trail Unit 10371016
- 0 Dogwood Trail Unit 20027357
- 0 Dogwood Trail Unit 20035415
- 0 Dogwood Trail
- Lot # 18 Dogwood Trail