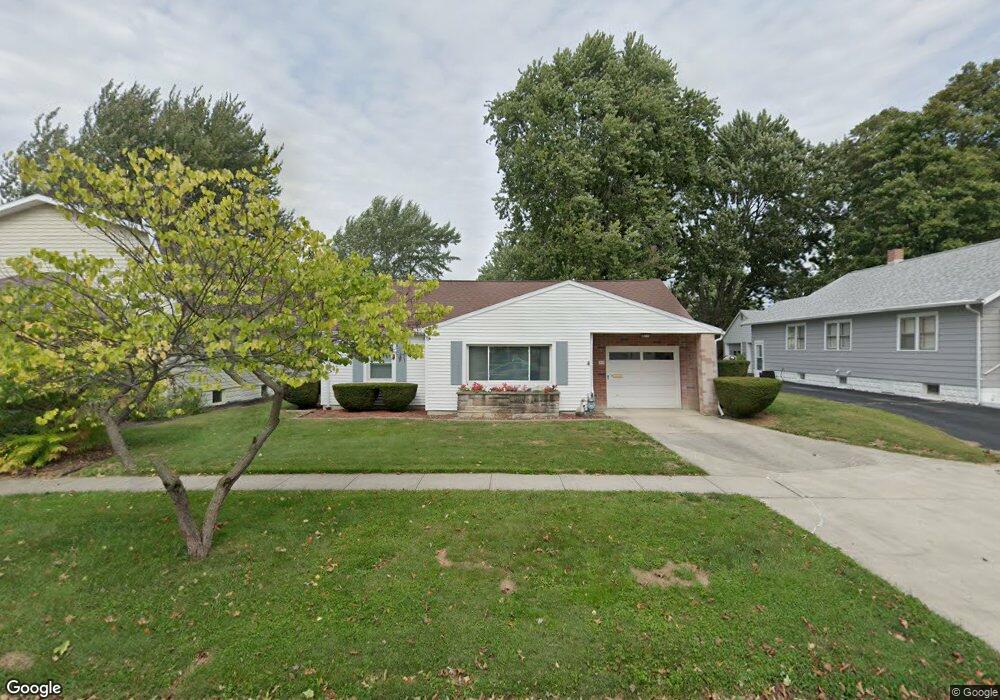
812 Cherry St Findlay, OH 45840
Estimated Value: $160,000 - $207,000
2
Beds
2
Baths
1,288
Sq Ft
$137/Sq Ft
Est. Value
About This Home
This home is located at 812 Cherry St, Findlay, OH 45840 and is currently estimated at $176,556, approximately $137 per square foot. 812 Cherry St is a home located in Hancock County with nearby schools including Whittier Elementary School, Wilson Vance Elementary School, and Donnell Middle School.
Ownership History
Date
Name
Owned For
Owner Type
Purchase Details
Closed on
Jun 21, 2004
Sold by
Purcell Carol Sue and Dillon Carol Sue
Bought by
Dillon Carol S
Current Estimated Value
Purchase Details
Closed on
Apr 2, 1998
Sold by
Trst James Treece
Bought by
Purcell Mark and Purcell Carol
Home Financials for this Owner
Home Financials are based on the most recent Mortgage that was taken out on this home.
Original Mortgage
$68,000
Outstanding Balance
$12,897
Interest Rate
7.09%
Mortgage Type
New Conventional
Estimated Equity
$163,659
Purchase Details
Closed on
Dec 29, 1993
Bought by
Treece James C and Treece Natalie M
Purchase Details
Closed on
Apr 17, 1989
Bought by
Treece James C and Treece Natalie M
Purchase Details
Closed on
Feb 3, 1986
Bought by
Beucler Cynthia S
Purchase Details
Closed on
Aug 31, 1984
Bought by
Beucler Claire W
Purchase Details
Closed on
Jun 24, 1983
Bought by
Beucler Claire W and Beucler Vera M
Create a Home Valuation Report for This Property
The Home Valuation Report is an in-depth analysis detailing your home's value as well as a comparison with similar homes in the area
Home Values in the Area
Average Home Value in this Area
Purchase History
| Date | Buyer | Sale Price | Title Company |
|---|---|---|---|
| Dillon Carol S | -- | -- | |
| Purcell Mark | $85,000 | -- | |
| Treece James C | -- | -- | |
| Treece James C | $52,900 | -- | |
| Beucler Cynthia S | $30,000 | -- | |
| Beucler Claire W | -- | -- | |
| Beucler Claire W | $36,800 | -- |
Source: Public Records
Mortgage History
| Date | Status | Borrower | Loan Amount |
|---|---|---|---|
| Open | Purcell Mark | $68,000 |
Source: Public Records
Tax History
| Year | Tax Paid | Tax Assessment Tax Assessment Total Assessment is a certain percentage of the fair market value that is determined by local assessors to be the total taxable value of land and additions on the property. | Land | Improvement |
|---|---|---|---|---|
| 2024 | $1,099 | $40,730 | $6,010 | $34,720 |
| 2023 | $1,123 | $40,730 | $6,010 | $34,720 |
| 2022 | $1,134 | $40,730 | $6,010 | $34,720 |
| 2021 | $989 | $33,050 | $6,330 | $26,720 |
| 2020 | $989 | $33,050 | $6,330 | $26,720 |
| 2019 | $969 | $33,050 | $6,330 | $26,720 |
| 2018 | $868 | $28,730 | $5,500 | $23,230 |
| 2017 | $869 | $28,730 | $5,500 | $23,230 |
| 2016 | $867 | $28,730 | $5,500 | $23,230 |
| 2015 | $1,295 | $29,610 | $5,500 | $24,110 |
| 2014 | $1,295 | $29,610 | $5,500 | $24,110 |
| 2012 | $1,304 | $29,610 | $5,500 | $24,110 |
Source: Public Records
Map
Nearby Homes
- 439 Carnahan Ave
- 1020 Country Club Dr
- 640 Center St
- 655 Clinton Ct
- 810 Mcconnell St
- 741 Central Ave
- 523 Center St
- 1308 Greendale Ave
- 1125 Glen Meadow Dr
- 1209 Heather Dr
- 309 Huron Rd
- 1001 Decker Ave
- 912 Parkside Place
- 716 Winfield Ave
- 1521 Middle Ct
- 623 E Sandusky St
- 213 Cherry St
- 207 Ash Ave
- 1142 Concord Ct
- 125 Cherry St
- 808 Cherry St
- 816 Cherry St
- 806 Cherry St
- 414 McManness Ave
- 826 Cherry St
- 802 Cherry St
- 417 Carnahan Ave
- 423 Carnahan Ave
- 428 McManness Ave
- 807 Cherry St
- 718 Cherry St
- 805 Cherry St
- 817 Cherry St
- 803 Cherry St
- 821 Cherry St
- 427 Carnahan Ave
- 801 Cherry St
- 716 Cherry St
- 434 McManness Ave
- 431 Carnahan Ave
Your Personal Tour Guide
Ask me questions while you tour the home.