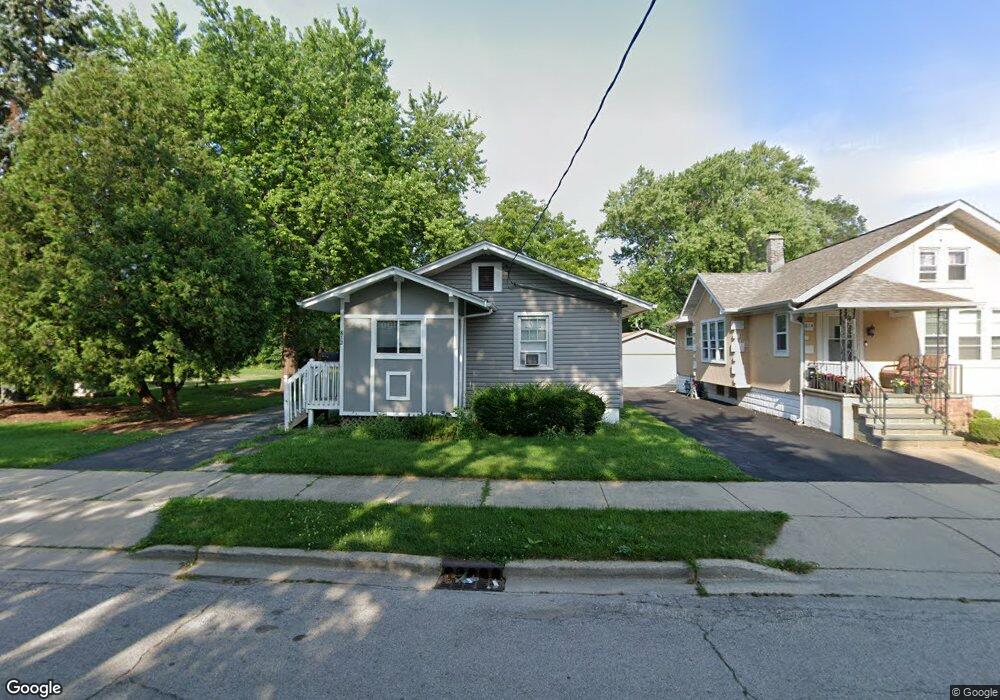
812 Chestnut St Waukegan, IL 60085
Estimated Value: $136,550 - $191,000
2
Beds
1
Bath
723
Sq Ft
$222/Sq Ft
Est. Value
About This Home
This home is located at 812 Chestnut St, Waukegan, IL 60085 and is currently estimated at $160,850, approximately $222 per square foot. 812 Chestnut St is a home located in Lake County with nearby schools including Glen Flora Elementary School, Edith M Smith Middle School, and Waukegan High School.
Ownership History
Date
Name
Owned For
Owner Type
Purchase Details
Closed on
Jul 13, 2021
Sold by
North Shore Trust And Savings
Bought by
Church Of Joy Inc
Current Estimated Value
Purchase Details
Closed on
Aug 29, 2017
Sold by
Villalobos Gabriela and Villalobos Eduardo
Bought by
Church Of Joy Inc
Home Financials for this Owner
Home Financials are based on the most recent Mortgage that was taken out on this home.
Original Mortgage
$52,000
Interest Rate
4.5%
Mortgage Type
Commercial
Purchase Details
Closed on
Sep 5, 2008
Sold by
Padilla Nancy L
Bought by
Villalobos Gabriela
Home Financials for this Owner
Home Financials are based on the most recent Mortgage that was taken out on this home.
Original Mortgage
$60,345
Interest Rate
5.73%
Mortgage Type
FHA
Purchase Details
Closed on
Apr 18, 2008
Sold by
Gibson Nathan L and Estate Of Arthur D Slavin
Bought by
Padilla Nancy L
Home Financials for this Owner
Home Financials are based on the most recent Mortgage that was taken out on this home.
Original Mortgage
$50,000
Interest Rate
5.87%
Mortgage Type
Purchase Money Mortgage
Create a Home Valuation Report for This Property
The Home Valuation Report is an in-depth analysis detailing your home's value as well as a comparison with similar homes in the area
Home Values in the Area
Average Home Value in this Area
Purchase History
| Date | Buyer | Sale Price | Title Company |
|---|---|---|---|
| Church Of Joy Inc | -- | None Available | |
| Church Of Joy Inc | $65,000 | Affinity Title Services Llc | |
| Villalobos Gabriela | $63,000 | Nat | |
| Padilla Nancy L | $65,000 | Attorneys Title Guaranty Fun |
Source: Public Records
Mortgage History
| Date | Status | Borrower | Loan Amount |
|---|---|---|---|
| Previous Owner | Church Of Joy Inc | $52,000 | |
| Previous Owner | Villalobos Gabriela | $60,345 | |
| Previous Owner | Padilla Nancy L | $50,000 |
Source: Public Records
Tax History Compared to Growth
Tax History
| Year | Tax Paid | Tax Assessment Tax Assessment Total Assessment is a certain percentage of the fair market value that is determined by local assessors to be the total taxable value of land and additions on the property. | Land | Improvement |
|---|---|---|---|---|
| 2024 | -- | -- | -- | -- |
| 2023 | -- | -- | -- | -- |
| 2022 | $0 | $0 | $0 | $0 |
| 2021 | $0 | $0 | $0 | $0 |
| 2020 | $0 | $0 | $0 | $0 |
| 2019 | $0 | $0 | $0 | $0 |
| 2018 | $2,724 | $24,373 | $9,192 | $15,181 |
| 2017 | $2,214 | $21,563 | $8,132 | $13,431 |
| 2016 | $1,968 | $18,737 | $7,066 | $11,671 |
| 2015 | $1,819 | $16,770 | $6,324 | $10,446 |
| 2014 | $1,206 | $12,663 | $5,419 | $7,244 |
| 2012 | $1,714 | $13,721 | $5,872 | $7,849 |
Source: Public Records
Map
Nearby Homes
- 620 N Poplar St
- 702 Franklin St
- 918 N Ash St
- 522 N Poplar St
- 511 Chestnut St
- 917 N Linden Ave
- 428 N Poplar St
- 1110 N Ash St
- 452 North Ave
- 1122 N Ash St
- 415 W Ridgeland Ave
- 325 4th St
- 1000 Pine St
- 824 N Butrick St
- 1105 Woodlawn Cir
- 509 N Butrick St
- 723 N County St
- 611 N Genesee St
- 1335 Chestnut St
- 1336 N Ash St
- 814 Chestnut St
- 818 Chestnut St
- 715 N Jackson St
- 822 Chestnut St
- 721 N Jackson St
- 720 Center St
- 826 Chestnut St
- 713 N Jackson St
- 801 N Jackson St
- 728 Chestnut St
- 718 Center St
- 713 Myrtle St
- 828 Chestnut St
- 803 N Jackson St
- 814 Edwards St
- 720 Chestnut St
- 714 Center St
- 816 Edwards St
- 711 Myrtle St
- 832 Chestnut St