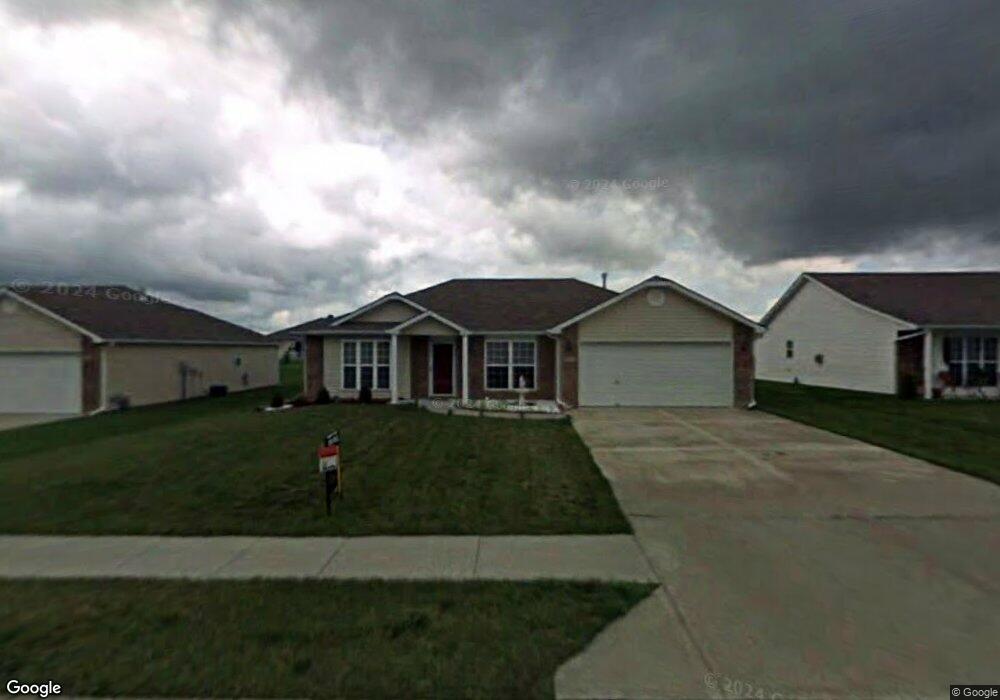
812 Clancy Ct Raymore, MO 64083
Estimated Value: $293,000 - $307,947
3
Beds
2
Baths
1,433
Sq Ft
$211/Sq Ft
Est. Value
About This Home
This home is located at 812 Clancy Ct, Raymore, MO 64083 and is currently estimated at $302,237, approximately $210 per square foot. 812 Clancy Ct is a home located in Cass County with nearby schools including Stonegate Elementary School, Raymore-Peculiar South Middle School, and Raymore-Peculiar Senior High School.
Ownership History
Date
Name
Owned For
Owner Type
Purchase Details
Closed on
Mar 10, 2009
Sold by
Rosas Ivan V and Rosas Nancy
Bought by
Us Bank Na
Current Estimated Value
Purchase Details
Closed on
Jun 10, 2007
Sold by
Us Bank N A Nd
Bought by
Smith Donald Ray
Home Financials for this Owner
Home Financials are based on the most recent Mortgage that was taken out on this home.
Original Mortgage
$77,520
Interest Rate
4.53%
Mortgage Type
New Conventional
Create a Home Valuation Report for This Property
The Home Valuation Report is an in-depth analysis detailing your home's value as well as a comparison with similar homes in the area
Home Values in the Area
Average Home Value in this Area
Purchase History
| Date | Buyer | Sale Price | Title Company |
|---|---|---|---|
| Us Bank Na | -- | None Available | |
| Smith Donald Ray | -- | None Available |
Source: Public Records
Mortgage History
| Date | Status | Borrower | Loan Amount |
|---|---|---|---|
| Previous Owner | Smith Donald Ray | $77,520 |
Source: Public Records
Tax History
| Year | Tax Paid | Tax Assessment Tax Assessment Total Assessment is a certain percentage of the fair market value that is determined by local assessors to be the total taxable value of land and additions on the property. | Land | Improvement |
|---|---|---|---|---|
| 2025 | $2,569 | $35,330 | $6,060 | $29,270 |
| 2024 | $2,569 | $31,570 | $5,510 | $26,060 |
| 2023 | $2,566 | $31,570 | $5,510 | $26,060 |
| 2022 | $2,330 | $28,480 | $5,510 | $22,970 |
| 2021 | $2,330 | $28,480 | $5,510 | $22,970 |
| 2020 | $2,329 | $27,960 | $5,510 | $22,450 |
| 2019 | $2,248 | $27,960 | $5,510 | $22,450 |
| 2018 | $2,067 | $24,820 | $4,590 | $20,230 |
| 2017 | $1,894 | $24,820 | $4,590 | $20,230 |
| 2016 | $1,894 | $23,610 | $4,590 | $19,020 |
| 2015 | $1,895 | $23,610 | $4,590 | $19,020 |
| 2014 | $1,809 | $22,520 | $4,590 | $17,930 |
| 2013 | -- | $22,520 | $4,590 | $17,930 |
Source: Public Records
Map
Nearby Homes
- 817 Clancy Ct
- 713 S Sunset Ln
- 901 W Lucy Webb Rd
- 1103 Carlisle Dr
- 1112 Carlisle Dr
- 1105 Creekside Ct
- 1108 Yokley Dr
- 709 Derby St
- 1024 S Madison St
- 1205 Sendera Trail
- 1510 Colt Cir
- 804 S Washington St
- 1228 Larkspur Place
- 1301 Larkspur Place
- 1227 Larkspur Place
- 1519 Colt Cir
- 1035 Mission Park Trail
- 1033 Mission Park Trail
- 1031 Mission Park Trail
- 1309 Larkspur Place
Your Personal Tour Guide
Ask me questions while you tour the home.