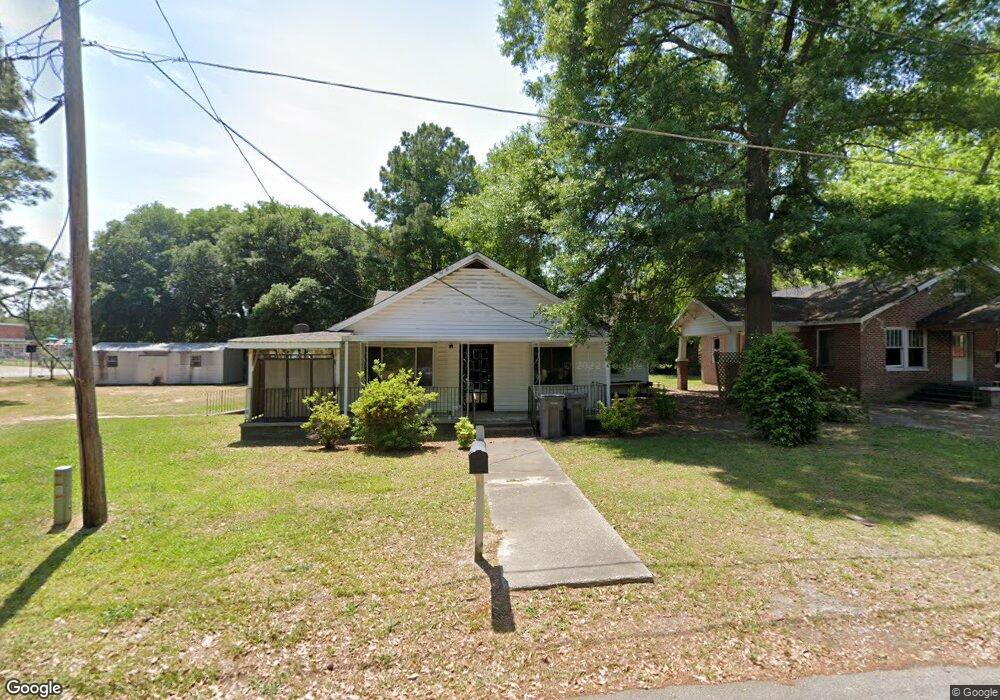
812 E 9th St Lumberton, NC 28358
Estimated Value: $118,000 - $200,000
6
Beds
4
Baths
2,866
Sq Ft
$54/Sq Ft
Est. Value
About This Home
This home is located at 812 E 9th St, Lumberton, NC 28358 and is currently estimated at $154,585, approximately $53 per square foot. 812 E 9th St is a home located in Robeson County with nearby schools including Rowland Norment Elementary School, Parkton Elementary School, and L. Gilbert Carroll Middle School.
Ownership History
Date
Name
Owned For
Owner Type
Purchase Details
Closed on
May 7, 2014
Sold by
Fm 611 Ltd
Bought by
Worley James Lamote
Current Estimated Value
Purchase Details
Closed on
Oct 31, 2011
Sold by
Fannie Mae
Bought by
Fm 611 Ltd
Purchase Details
Closed on
Apr 26, 2011
Sold by
Moore Denise
Bought by
Federal National Mortgage Association
Purchase Details
Closed on
Oct 19, 2006
Sold by
Stewart Treva L
Bought by
Moore Denise
Home Financials for this Owner
Home Financials are based on the most recent Mortgage that was taken out on this home.
Original Mortgage
$81,605
Interest Rate
6.45%
Mortgage Type
New Conventional
Create a Home Valuation Report for This Property
The Home Valuation Report is an in-depth analysis detailing your home's value as well as a comparison with similar homes in the area
Purchase History
| Date | Buyer | Sale Price | Title Company |
|---|---|---|---|
| Worley James Lamote | $23,000 | None Available | |
| Fm 611 Ltd | $18,500 | None Available | |
| Federal National Mortgage Association | -- | -- | |
| Moore Denise | $86,000 | -- |
Source: Public Records
Mortgage History
| Date | Status | Borrower | Loan Amount |
|---|---|---|---|
| Previous Owner | Moore Denise | $81,605 |
Source: Public Records
Tax History
| Year | Tax Paid | Tax Assessment Tax Assessment Total Assessment is a certain percentage of the fair market value that is determined by local assessors to be the total taxable value of land and additions on the property. | Land | Improvement |
|---|---|---|---|---|
| 2025 | $759 | $90,500 | $8,800 | $81,700 |
| 2024 | $754 | $90,500 | $8,800 | $81,700 |
| 2023 | $530 | $60,500 | $8,000 | $52,500 |
| 2022 | $530 | $60,500 | $8,000 | $52,500 |
| 2021 | $530 | $60,500 | $8,000 | $52,500 |
| 2020 | $515 | $60,500 | $8,000 | $52,500 |
| 2018 | $526 | $53,300 | $8,000 | $53,300 |
| 2017 | $532 | $53,300 | $0 | $53,300 |
| 2016 | $532 | $53,300 | $0 | $53,300 |
| 2015 | $532 | $53,300 | $0 | $53,300 |
| 2014 | $532 | $53,300 | $0 | $53,300 |
Source: Public Records
Map
Nearby Homes
Your Personal Tour Guide
Ask me questions while you tour the home.